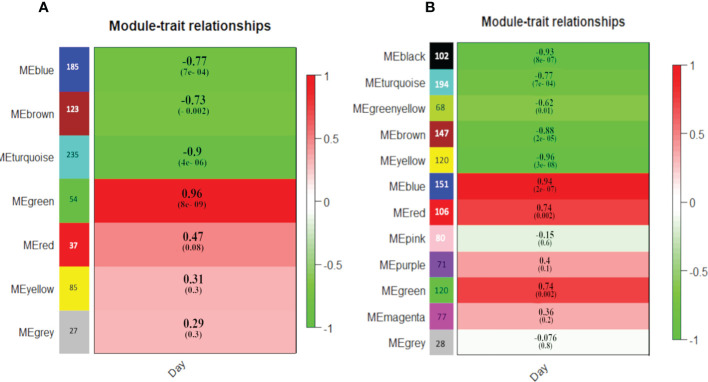
Figure 6.
Module-Day trait association identified by WGCNA in SAG peach (A) and BT nectarine (B). Each row corresponds to a module. The number of genes in each module is indicated on the left. The heat map indicates the correlation of each module with days of storage with the score and significance (P values in brackets) according to a Pearson analysis.

