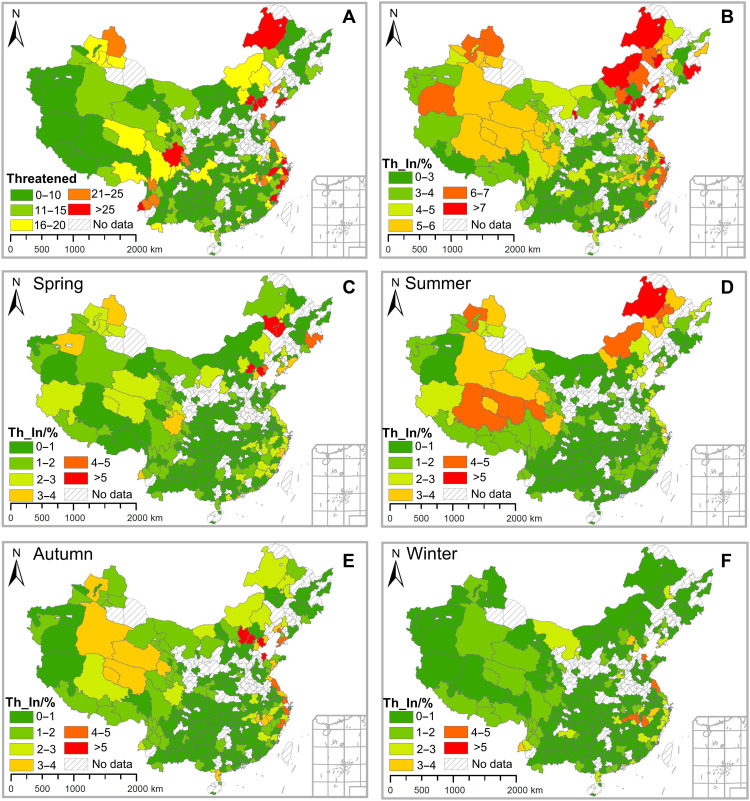
Fig. 2. Prefecture-level spatial variation in threatened bird numbers.
(A) Distribution of numbers of threatened species at the prefecture level. (B) Distribution of the threatened species index (Th_In, %) at the prefecture level throughout the year. (C) Distribution of threatened species index at the prefecture level in spring. (D) Distribution of threatened species index at the prefecture level in summer. (E) Distribution of threatened species index at the prefecture level in autumn. (F) Distribution of threatened species index at the prefecture level in winter.

