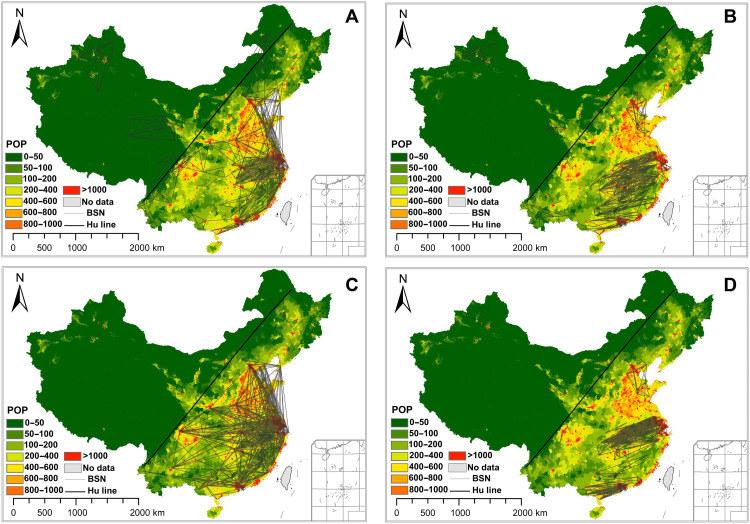
Fig. 5. Bird similarity network.
(A) All BSNs based on birdwatching data. The data comprised population spatial distribution data on a 1-km grid in China in 2015. The values represent the population (POP) within that grid extent. East of the Hu line (black solid line) is a hot spot of diversity. At the same time, the similarity of birds is higher, and the regions with high population density are closely connected. (B) All BSNs based on SDMs. The data comprised bird spatial distributions based on SDMs. (C) Similarity network based on birdwatching data for birds whose PLCTs are urban and built-up lands. (D) Similarity network based on SDMs for birds whose PLCTs are urban and built-up lands.

