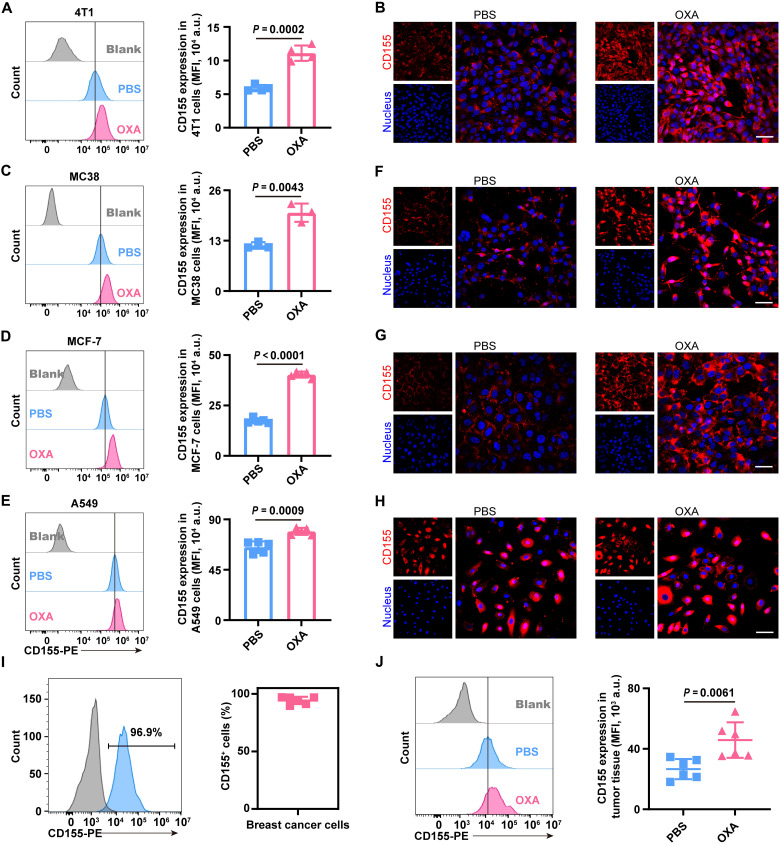
Fig. 2. Up-regulation of CD155 in tumor cells after OXA treatment.
(A and B) Expression of CD155 in 4T1 cells after OXA treatment. (A) Representative flow cytometry image (left) of 4T1 cells treated with PBS or OXA and the corresponding quantification (right) of CD155 MFI (n = 4 biological replicates per group). (B) Representative confocal images of 4T1 cells treated with PBS or OXA (red, CD155; blue, nuclei). Scale bar, 50 μm. (C to E) Expression of CD155 in MC38 cells (C), MCF-7 cells (D), or A549 cells (E) after OXA treatment. Representative flow cytometry image (left) and the corresponding quantification (right) of CD155 MFI. n = 3 biological replicates per group for (C), and n = 5 biological replicates per group for (D) and (E). (F to H) Representative confocal images of MC38 cells (F), MCF-7 cells (G), or A549 cells (H) treated with PBS or OXA (red, CD155; blue, nuclei). Scale bars, 50 μm. (I) In vivo CD155 expression on tumor cells in 4T1 tumor-bearing mice. Representative flow cytometry image (left) and frequency (right) of CD155+ tumor cells in 4T1 tumors (n = 6 biologically independent mice per group). (J) In vivo CD155 expression on tumor cells in 4T1 tumor-bearing mice after treatment with PBS or OXA. Representative flow cytometry image (left) and the quantification of CD155 expressed as MFI (right) (n = 6 biologically independent mice per group). Statistical significance was calculated by unpaired two-tailed t test for (A), (C) to (E), and (J). a.u., arbitrary units.

