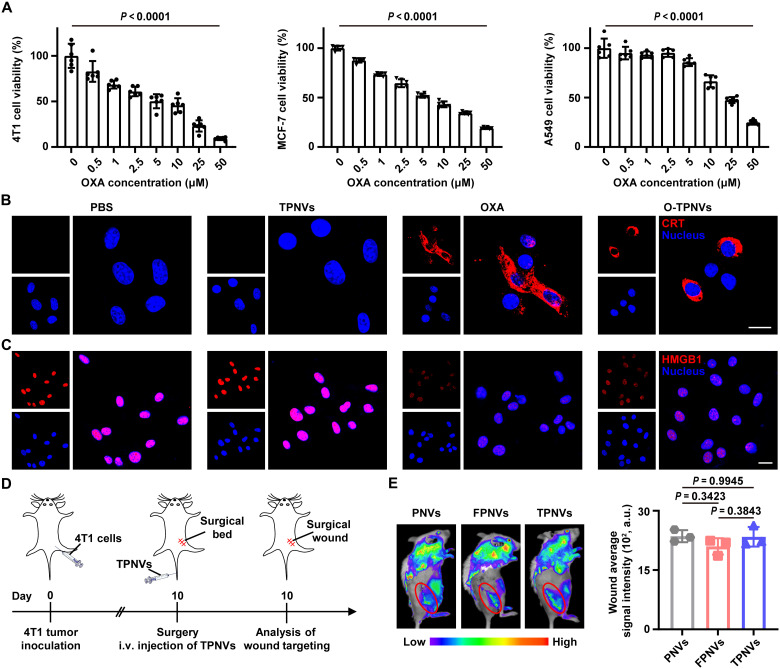
Fig. 4. In vitro biological effects and in vivo targeting.
(A) Viabilities of different tumor cells (4T1, MCF-7, or A549 cells) after 48 hours of incubation with O-TPNVs, with different OXA concentrations (0, 0.5, 1, 2.5, 5, 10, 25, or 50 μM) (n = 6 biological replicates per group). (B) Immunofluorescence images of CRT exposure on the surface of 4T1 cells after different treatments as indicated (red, CRT; blue, nuclei). Scale bar, 20 μm. (C) Immunofluorescence images showing HMGB1 release in 4T1 cells after different treatments as indicated (red, HMGB1; blue, nuclei). Scale bar, 20 μm. (D) Schematic showing the wound targeting analysis schedule for postsurgical mice. (E) Fluorescence imaging (left) and the corresponding fluorescence intensity of wound sites (right) at 2 hours after intravenous injection of PNVs, FPNVs, or TPNVs labeled with Cy5.5-NHS (n = 3 biologically independent mice per group). Statistical significance was calculated by one-way ANOVA with a Tukey post hoc test for (A) and (E).

