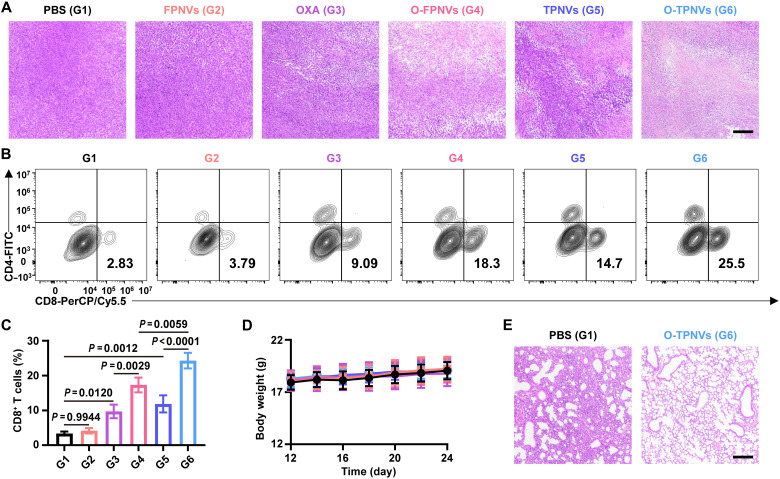
Fig. 6. In vivo antitumor immune response of O-TPNVs.
(A) Representative H&E staining of recurrent tumors collected from the mice in different groups. Scale bar, 100 μm. (B and C) Representative flow cytometric analysis images (B) and relative quantification (C) of infiltrating CD8+ T cells in recurrent tumors (n = 3 biologically independent mice per group). (D) Body weights of mice in different groups (n = 6 biologically independent mice per group). (E) H&E staining of lungs collected from the mice treated with PBS and O-TPNVs. Scale bar, 100 μm. Statistical significance was calculated by one-way ANOVA with a Tukey post hoc test for (C).

