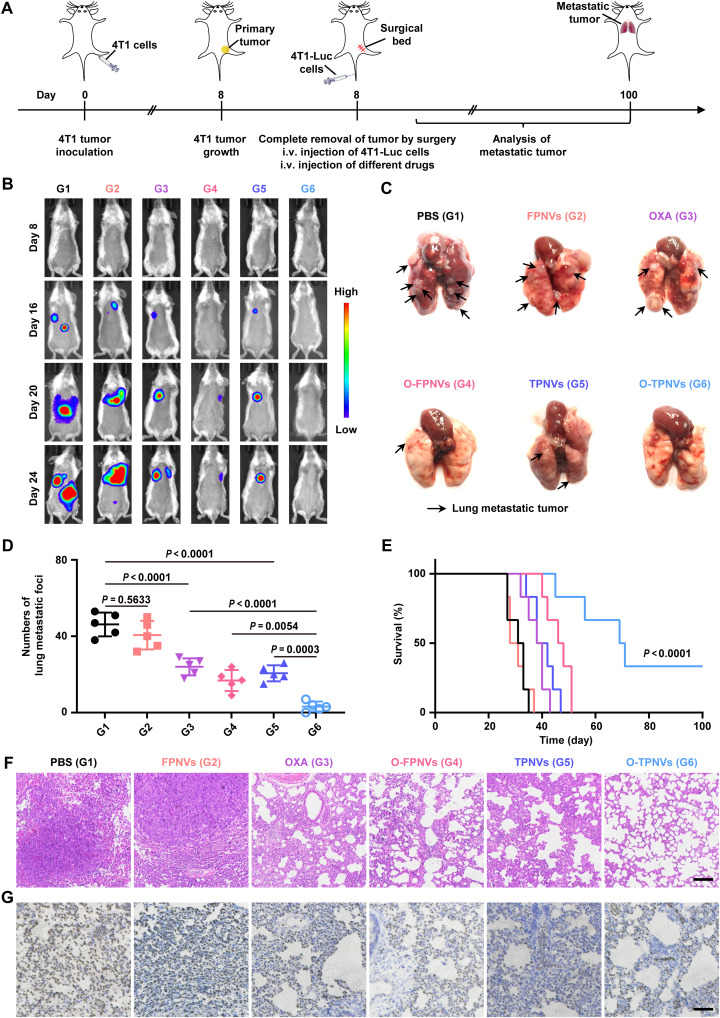
Fig. 7. In vivo study on the effect of antitumor metastasis.
(A) Schematic representation of the therapy schedule in a 4T1 tumor metastasis mouse model. (B) Representative bioluminescence images of 4T1 tumor metastasis in mice. (C) Representative lung images in different groups as indicated. The black arrows indicate the lung metastasis tumors. (D) Numbers of lung metastatic foci of mice (n = 5 biologically independent mice per group). (E) Survival curves for mice (n = 6 biologically independent mice per group). (F and G) Representative images of lung tissue stained with H&E (F) and Ki-67 (G). Scale bars, 500 μm. Statistical significance was calculated by one-way ANOVA with a Tukey post hoc test for (D) or log-rank (Mantel-Cox) test for (E).

