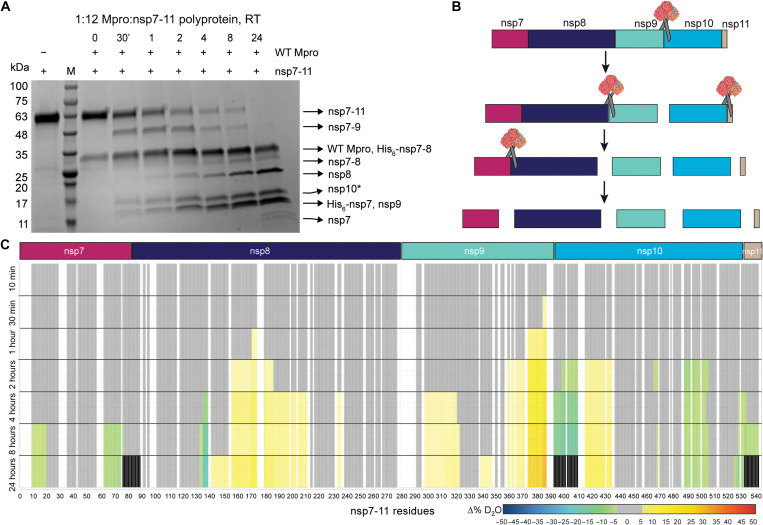
Fig. 1. In vitro analysis of SARS-CoV-2 nsp7-11 polyprotein processing by WT Mpro.
(A) SDS–polyacrylamide gel electrophoresis (PAGE) showing the limited proteolysis of nsp7-11 polyprotein by Mpro over a time course of 24 hours at RT (room temperature). +/− shows the presence or absence of the respective proteins. The lane labeled as M is the protein marker. Black arrows on the right indicate the proteins generated from the cleavage of nsp7-11 polyprotein by Mpro. (B) Schematic representation of the cleavage order of the nsp7-11 polyprotein by Mpro. (C) Pulsed HDX-MS analysis of nsp7-11 with Mpro. Color scale represents changes in deuterium uptake over the course of the cleavage reaction, with gray representing no significant change in deuterium uptake, white denoting no sequence coverage, and black representing residues within peptides that are no longer identifiable.

