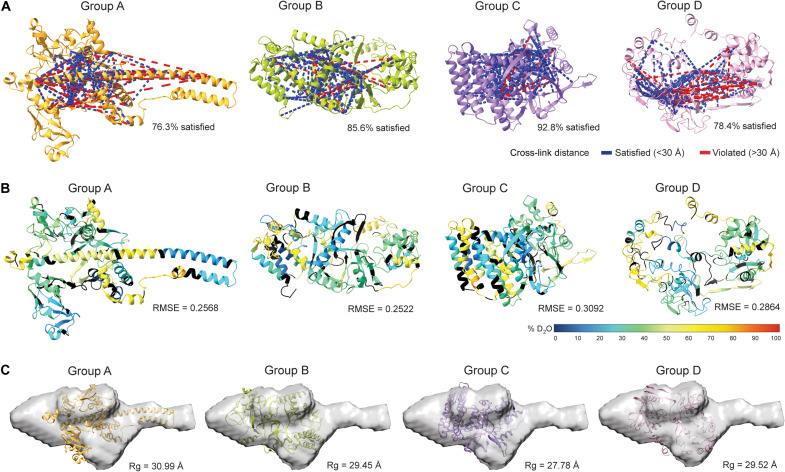
Fig. 4. Assessment of representative nsp7-11 models based on experimental data.
(A) Mapping of nsp7-11 intraprotein cross-links onto representative nsp7-11 models. Satisfied cross-links equal to or less than 30 Å are shown in blue, and violated cross-links greater than 30 Å are shown in red. Percent of cross-links satisfied is reported under the structure. (B) Representative nsp7-11 models are colored on the basis of 10 s of percent deuterium value. Black indicates no sequence coverage in the HDX-MS experiment. Agreement of model with experimental data as calculated by HDXer is reported as the RMSE under the model. (C) Fitting of representative nsp7-11 models into the SAXS envelope and Rg values are reported under the model.

