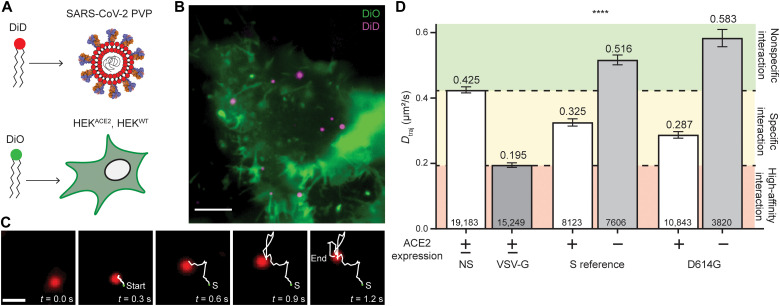
Fig. 1. Single-virus tracking indicates that D614G enhances interaction with target cells.
(A) PVPs are labeled with DiD and HEK cells are labeled with DiO to observe the lipid envelope/membrane. (B) Example TIRF image of DiO-labeled HEK cells with DiD-labeled PVPs. Scale bar, 5 μm. (C) Detected particles are subjected to a multiple hypothesis tracking algorithm. An example PVP is shown here, 5 of 50 frames, with detected trajectory trailing. Scale bar, 1 μm. (D) Dtraj for particles that have a trajectory of at least eight frames. The green area represents nonspecific diffusion, the yellow area represents specific interaction diffusion (DNS > Dtraj > DVSV-G), and the red area represents high-affinity interaction. ****P < 0.0001 in all pairwise comparisons. Trajectory sample size, from at least two independent experiments, is indicated at the bottom of each bar. Error bars represent SE.

