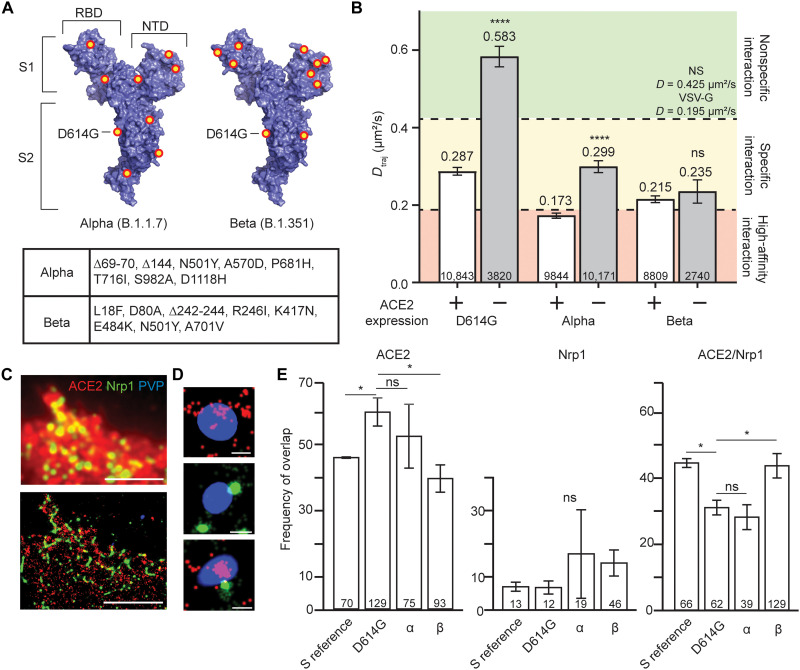
Fig. 2. Globally circulating variants interact with host cells in an ACE2-independent manner.
(A) Mutations and deletions (red/yellow dots) for the Alpha (left) and Beta (right) variants of SARS-CoV-2 S monomer [Protein Data Bank (PDB) 6VXX] (52). Inset table lists the mutations for each variant. (B) Dtraj for trajectories greater than eight frames. Colored areas represent the same control ranges from Fig. 1D. ****P < 0.0001. Trajectory sample size, from at least two independent experiments, is indicated at the bottom of each bar. (C) Representative epifluorescence image (top) and corresponding reconstructed STORM image (bottom) of HEKACE2 cells immunostained for ACE2 (red) and Nrp1 (green) incubated with DiO-labeled PVPs (blue). Scale bars, 5 μm. (D) Representative magnified STORM/TIRF images of single PVPs colocalized with ACE2 (top), Nrp1 (middle), or ACE2/Nrp1 (bottom). Scale bars, 200 nm. Average full width at half maximum of PVPs is 275 nm (fig. S3A). Additional representative magnified particles can be found in fig. S3B. (E) PVPs categorized into populations according to (D) and calculated as percent of the total observed particles. *P < 0.05. PVP sample size, from at least two independent experiments, is indicated at the bottom of each bar. Particles were extracted from the following number of individual cells; S reference, 23; D614G, 21; α, 20; β, 31. Error bars represent SE. ns, not significant.

