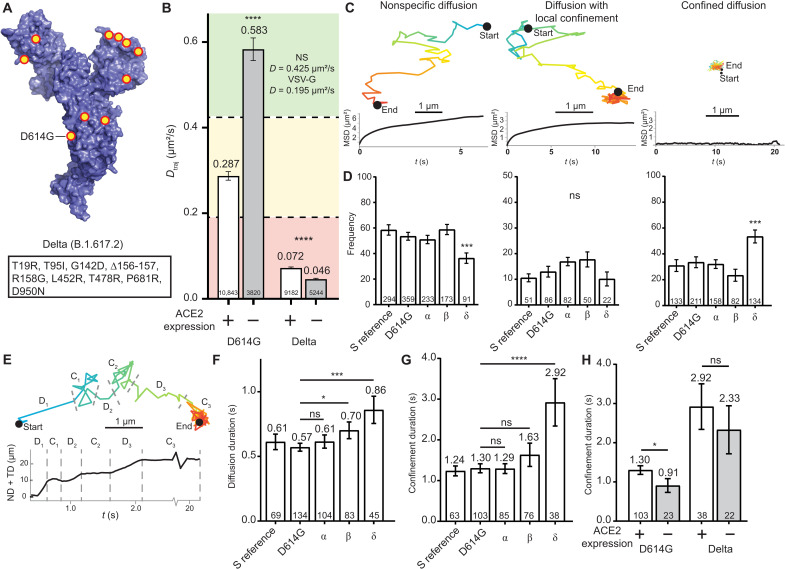
Fig. 3. The Delta variant produces a strong ACE2-independent interaction and exhibits reduced motion at the cell surface.
(A) Mutations and deletions (red/yellow dots) for the Delta variant of the SARS-CoV-2 monomer (PDB 6VXX) (52). Inset table lists the mutations. (B) Dtraj for trajectories greater than eight frames. Colored areas represent the same control ranges from Fig. 1D. ****P < 0.0001. Trajectory sample size, from at least two independent experiments, is indicated at the bottom of each bar. (C) Representative trajectories and MSD curves for DN (left), DLC (middle), and DC (right). (D) Percentage of trajectory population in each classification. ***P < 0.001. (E) Top: Representative DLC trajectory with dotted lines indicating transition points between states. Bottom: Representative sum of the net and total displacement, with a rolling average of five frames. (F) Average diffusion durations for each variant PVP. *P < 0.05 and ***P < 0.001. (G) Average confinement durations for each variant PVP. ****P < 0.0001. (H) Comparison of confinement durations of D614G and Delta variant S for HEKACE2 and HEKWT cells. *P < 0.05 Trajectory sample size, from at least two independent experiments, is indicated at the bottom of each bar. Error bars represent SE.

