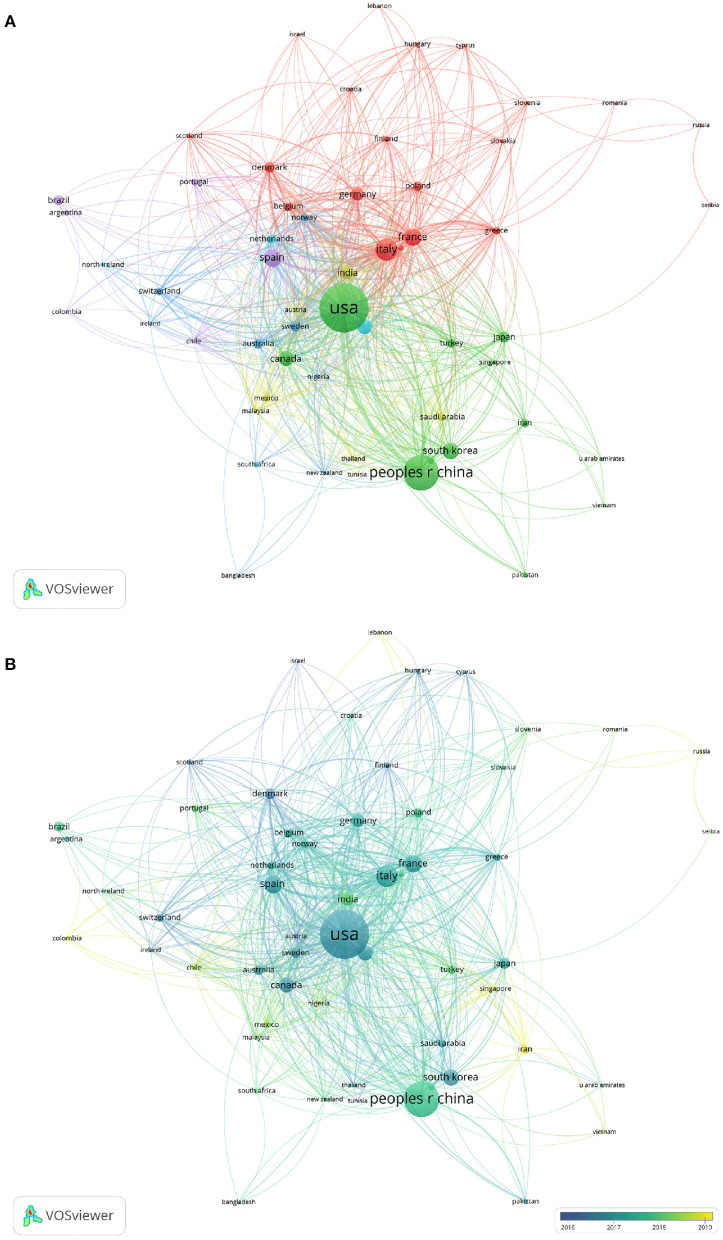
Figure 4.
The network map of co-authorship between countries with more than five publications. (A) The network visualization map of co-authorship between countries with more than five publications. (B) The overlay visualization map of co-authorship between countries with more than five publications. The distance between circles reflects the relationship strength between different countries based on how frequently they occur together. The size of the circle represents their total link strength.

