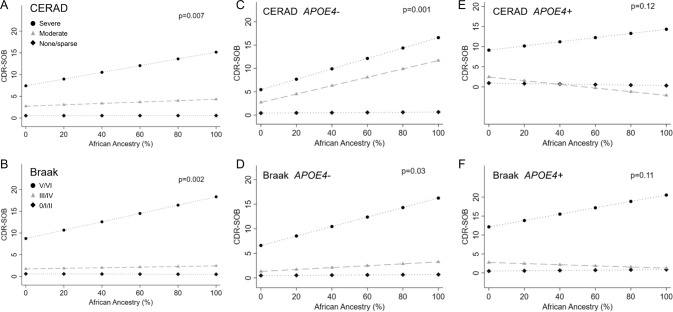
Fig. 2. Association between African global ancestry and cognitive outcomes stratified by neuropathology and APOE4 status.
Linear regression models of African ancestry and Clinical Dementia Rating Sum of Boxes (CDR-SOB) considering an interaction term between African ancestry and neuritic plaques evaluated by the CERAD score (A, C, E), or neurofibrillary tangle burden evaluated by the Braak & Braak stage (B, D, F). A neuritic plaque burden in all individuals [Black diamond: None or sparse (n = 303); Gray triangle: Moderate (n = 49); Black circle: Frequent (n = 48)]; (B) neurofibrillary tangle burden in all individuals [Black diamond: 0-II (n = 263); Gray triangle: III-IV (n = 99); Black circle: V-VI (n = 38)]; (C) neuritic plaques in APOE4− individuals [Black diamond: None or sparse plaques (n = 239); Gray triangle: Moderate plaques (n = 31); Black circle: Frequent plaques (n = 22)]; (D) neurofibrillary tangles in APOE4− individuals [Black diamond: Braak 0-II (n = 206); Gray triangle: Braak III-IV (n = 64); Black circle: Braak V-VI (n = 22)]; (E) neuritic plaques in APOE4+ individuals [Black diamond: None or sparse plaques (n = 64)]; Gray triangle: Moderate plaques (n = 18); Black circle: Frequent plaques (n = 26); and (F) neurofibrillary tangles in APOE4 + individuals [Black diamond: Braak 0-II (n = 57); Gray triangle: Braak III-IV (n = 35); Black circle: Braak V-VI (n = 16)]. P values for the interaction terms included in linear regression models adjusted for age, sex, education, and APOE4 status (A, B). Neuritic plaques were evaluated by the Consortium to Establish a Registry for Alzheimer’s disease (CERAD) score, and neurofibrillary tangles were evaluated by the Braak staining system.

