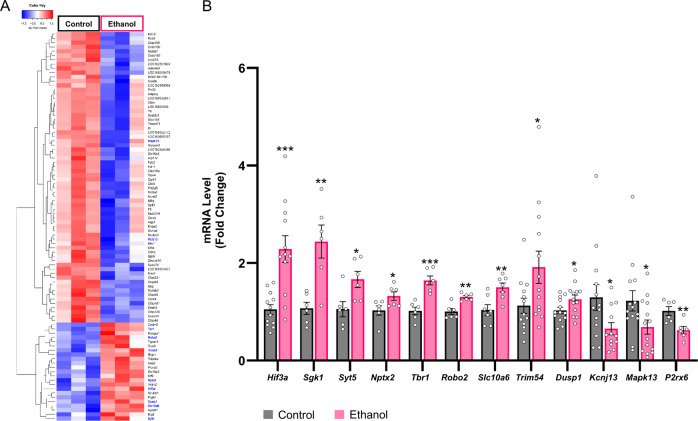
Fig. 2. RNA-seq data analysis in the amygdala of acute ethanol-exposed rats.
A HeatMap of RNA-seq differentially expressed transcripts at FDR < 0.2.Hierarchical clustering and heatmap of differentially expressed mRNAs (FDR < 0.2) from acute ethanol and normal saline (control) treated rats. Red represents increases in overall expression and blue represents decreases in expression. Individual mRNAs are represented in rows and individual experiments (n = 3 in each treatment; RNA from two rats are pooled for each treatment) are shown in columns. Gene names highlighted in blue were used for the validations. B Validations of mRNA levels of selected candidates from RNA-seq data in the amygdala of acute ethanol exposed rats. Expression levels of mRNAs were significantly different in the amygdala of acute ethanol-exposed rats compared to saline-treated control rats, as measured by qPCR. Data represents the mean ± SEM and individual values are shown on bar diagrams with circle dots for control and ethanol groups (n = 6–14; Two-tailed Student’s t test; *p < 0.05; **p < 0.01; ***p < 0.001).

