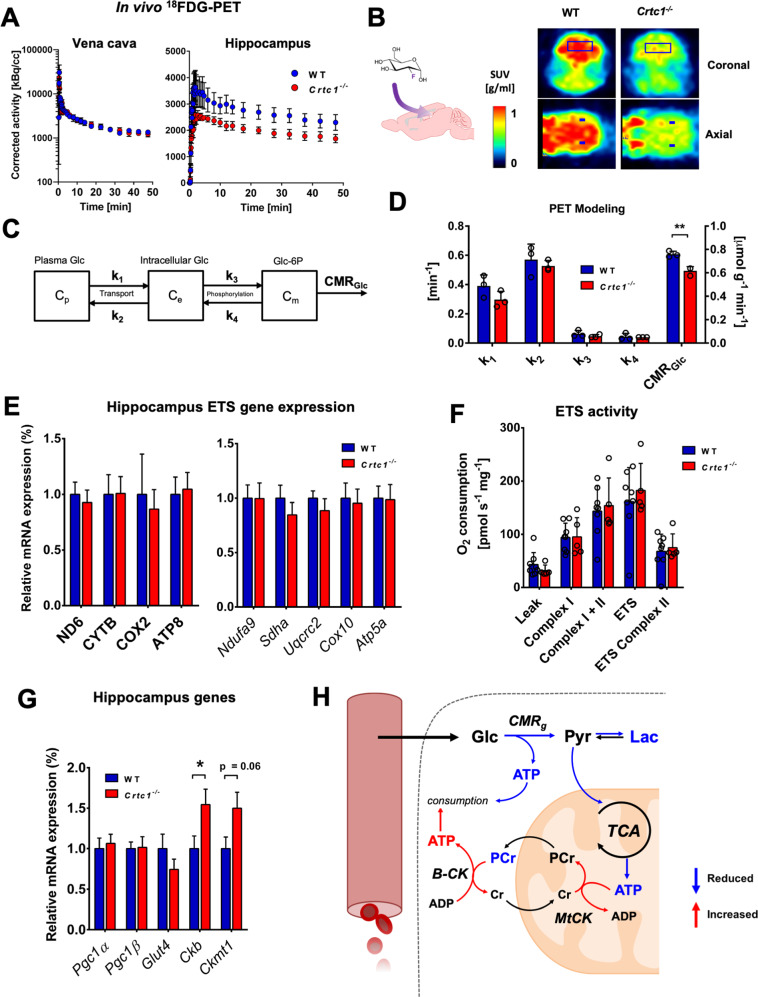
Fig. 2. Deletion of Crtc1 impacts hippocampal glycolytic metabolism with subsequent mitochondrial allostatic load.
A–C In vivo 18FDG-PET results show reduced glycolytic activity in the hippocampus of in Crtc1−/− mice compared to wild-type (WT) mice. A Time course of the radioactive decay-corrected activity, to the start of the acquisition, for vena cava (left) and hippocampus (right) in wild-type (n = 3) and Crtc1−/− (n = 3) mice. B Schematic of brain 18FDG uptake (left) and heat-maps of standard uptake values (SUVs) at steady-state (last 5 min) after 18FDG delivery in one Crtc1−/− and wild-type mouse (right). C Mathematical model used for assessing glucose entry and metabolism from PET data. Glucose (Glc) is in exchange between one plasma (Cp) and one intracellular (Ce) pool with kinetic constants k1 and k2. A glucose-6-phosphate (Glc-6P) pool (Cm) is produced from phosphorylation of intracellular Glc via kinetic constants k3 and k4. Glc-6P is then further metabolized through glycolysis, referred to here as the “cerebral metabolic rate of glucose” (CMRGlc), D Glucose metabolism parameter estimates from mathematical modeling of hippocampal 18FDG-PET data. **p < 0.005, unpaired Student’s t test. E–G Mitochondrial status is not directly affected by deletion of Crtc1. E Relative electron transfer system (ETS) gene expression in dorsal hippocampus of wild-type (n = 9) and Crtc1−/− (n = 7) mice. mtDNA-encoded: ND6, complex I; CYTB, complex II; COX2, complex IV; ATP8, complex V. nDNA-encoded: Ndufa9, complex I; Sdha, complex II; Uqcrc2, complex III; Cox10, complex IV; Atp5a, complex V. F Mitochondrial respirometry in dorsal hippocampus of wild-type (n = 8) and Crtc1−/− (n = 5) mice. G Mitochondrial gene expression in dorsal hippocampus of wild-type (n = 9) and Crtc1−/− (n = 8) mice. Pgc1α and β, Peroxisome proliferator-activated receptor gamma coactivator 1 alpha and beta; Ckb, creatine kinase B-type; Ckmt1, creatine kinase mitochondrial type. H Schematic representation of hippocampal mitochondrial allostatic load. Reduced glycolytic function leads to fewer pyruvate available for oxidation in the mitochondria. The resulting lack of ATP produced from mitochondria and glycolysis is compensated by higher PCr hydrolysis, which helps buffer ATP depletion to maintain homeostasis and potentially stimulated by the upregulation of creatine kinases expression. Glc glucose, Pyr pyruvate, B-CK cytoplasmic creatine kinase, MtCK mitochondrial creatine kinase. All data are shown as mean ± s.e.m.

