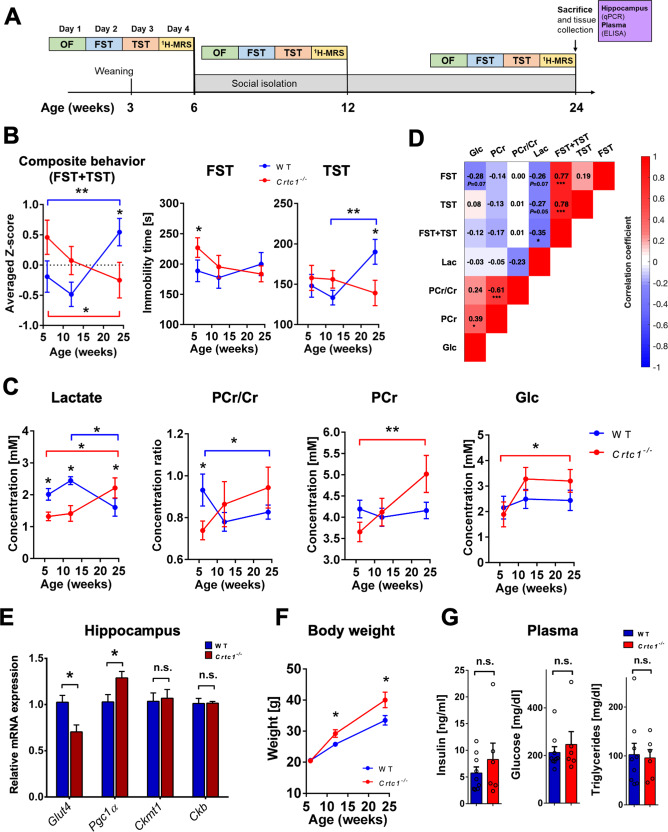
Fig. 3. Hippocampal neuroenergetic status reflects the depressive-like behavior of Crtc1−/− mice.
A Experimental design, and timeline of the longitudinal protocol used involving social isolation. Wild-type (WT; n = 10) and Crtc1−/− (n = 6) mice underwent a set of behavioral tests including an open-field test (OF; day 1), a forced swim test (FST; day 2) and a tail-suspension test (TST; day 3) followed by a 1H-MRS scan on day 4. After this first set of experiments, animals were isolated at the age of 6 weeks and the whole procedure was repeated at 12 and 24 weeks of age. After the last 1H-MRS scan, animals were sacrificed, and hippocampal and plasma samples were collected for analysis. B A switch in depressive-like behavior between Crtc1−/− and wild-type mice occurs after 18 weeks of social isolation as revealed by the inversion in immobility time in TST (right panel; Interaction: F2,28 = 5.16, p = 0.012), FST (center panel; Interaction: F2,28 = 3.87, p = 0.035) and averaged z-score of TST and FST (left panel; Interaction: F2,28 = 10.26, p = 0.0005). Two-way ANOVA, followed by Fisher LSD post hoc test; *p < 0.05, **p < 0.01. C Hippocampal neuroenergetic profile switches between Crtc1−/− and wild-type mice at the end of 18 weeks of isolation as revealed by the inversion of lactate concentration (left panel; Interaction: F2,28 = 7.32, p = 0.003), PCr/Cr ratio (center left panel; Interaction: F2,28 = 2.79, p = 0.08) and PCr (center right panel; Interaction: F2,28 = 4.78, p = 0.017). Hippocampal glucose levels increased in the Crtc1−/− group only at the end of the 18 weeks of isolation (Time effect: F2,28 = 3.43, p = 0.050). Two-way ANOVA, followed by Bonferroni’s post hoc test; *p < 0.05, **p < 0.01. D Correlative analysis between depressive-like behavior and hippocampal energy metabolite content. A significant negative correlation between Lac and behavior was found when results from FST and TST were considered together (R = −0.351, p = 0.013). Color code represents Pearson’s correlation coefficient and the analysis included all longitudinal age time points. Pearson’s Rs are shown for each correlation with associated p value (uncorrected for multiple comparisons); *p < 0.05, ***p < 0.0001. E At the end of 18 weeks of isolation, hippocampal levels of Pgc1α mRNA were higher while Glut4 levels were lower in Crtc1−/− as compared to wild-type mice. Mitochondrial and cytoplasmic creatine kinases were not significantly different (n.s.) between the two groups. Unpaired Student’s t test, *p < 0.05. F Body weight of all animals increased significantly over time (Time effect: F2,28 = 123.2, p < 0.0001) but increased more in the Crtc1−/− group (Genotype effect: F1,14 = 5.84, p = 0.030; Interaction: F2,28 = 5.11, p = 0.013). Two-way ANOVA followed by Fisher LSD post hoc test *p < 0.05. G Plasma markers of metabolic syndrome (insulin, glucose and triglycerides) were high in both groups but not significantly different from each other (n.s.).

