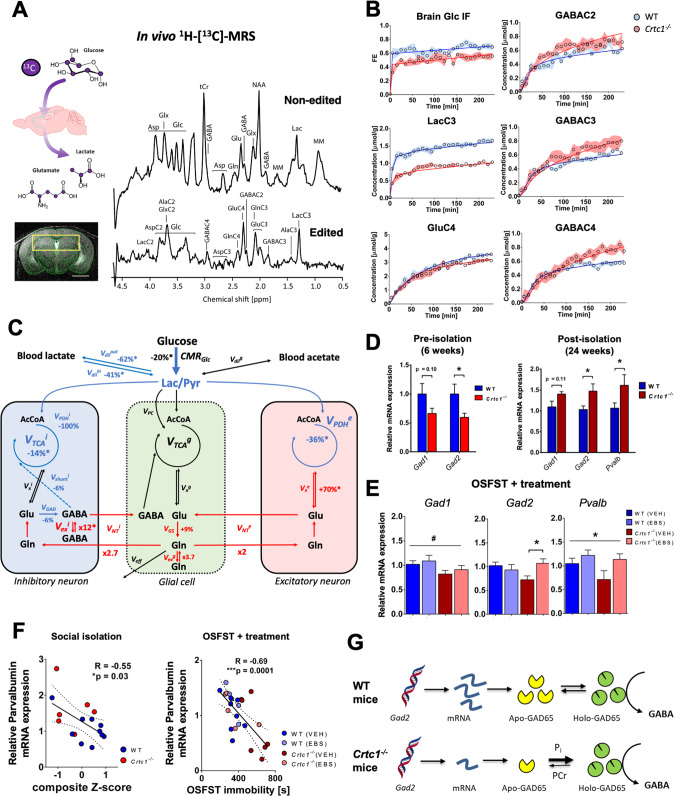
Fig. 5. GABAergic dysfunction links impaired hippocampal glucose metabolism with depressive-like behavior in Crtc1−/− susceptible mice.
A Schematic of 13C-labeled glucose brain uptake and subsequent metabolite labeling (upper left) 1H-[13C]-MRS spectra acquired in the bilateral dorsal hippocampus of a 6 weeks old WT mouse (right) as shown with the selected VOI (yellow box) on the associated MRI image (lower left). The non-edited spectrum (top) shows the total metabolic profile, while the edited spectrum (bottom) identifies the fraction of metabolites that have incorporated 13C-labeling. Scale bar = 2 mm. B Fractional isotopic 13C-enrichment (FE) of glucose and key metabolites in the hippocampus during 1H-[13C]-MRS experiment. Fitting of the data with a pseudo 3-compartment model of brain glucose metabolism is shown with a straight line for wild-type (WT; in blue) and Crtc1−/− (in red) mice. 6 weeks old wild-type (n = 8) and Crtc1−/−(n = 8). Data presented as mean ± s.d. C Schematic representation of hippocampal glucose utilization differences between wild-type and Crtc1−/− mice after metabolic flux analysis using a pseudo 3-compartment model. Metabolic fluxes that were higher in Crtc1−/− animals (compared to their wild-type littermates) are shown in red, while those found lower are shown in blue and those found without any difference or fixed during the modeling remain in black. Cerebral metabolic rate of glucose (CMRGlc); brain lactate influx (Vdilin) and outflux (Vdilout) from blood; pyruvate dilution flux (Vdilg); excitatory neuron TCA cycle (VPDHe); inhibitory neuron pyruvate dehydrogenase activity (VPDHi); GABA shunt flux (Vshunti); inhibitory neuron TCA cycle (VTCAi = VPDHi + Vshunti); glial pyruvate carboxylase (VPC); glial TCA cycle (VTCAg); excitatory neuron (Vxe), inhibitory neuron (Vxi) and glial (Vxg) transmitochondrial fluxes; excitatory neurotransmission flux (VNTe); inhibitory neurotransmission flux (VNTi); glutamate decarboxylase activity (VGAD); Gln exchange flux (Vexg); GABAergic exchange flux (Vexi); glutamine synthetase activity (VGS) and Gln efflux (Veff). Relative flux increase/decrease is indicated for Crtc1−/− mice compared to WT littermates, as calculated from fluxes in µmol/g/min from Fig. S5C; and an asterisk (*) indicates a statistically significant difference between the two groups. D GABAergic gene expression (Gad1, Gad2 and parvalbumin (Pvalb)) in the hippocampus under basal conditions (6 weeks age; left) or after social isolation (24 weeks age; right). Unpaired Student’s t test, *p < 0.05; basal, wild-type (n = 6) and Crtc1−/− (n = 6); longitudinal, wild-type (n = 10) and Crtc1−/− (n = 6). E Hippocampal gene expression of Gad1, Gad2 and Pvalb after the OSFST protocol (wild-type(VEH), n = 9; wild-type(EBS), n = 8; Crtc1−/−(VEH), n = 9; Crtc1−/−(EBS), n = 6). Gad1 was significantly reduced in the Crtc1−/− group (Genotype effect: F1,28 = 4.39, *p = 0.045, two-way ANOVA), while ebselen treatment increased the levels of Gad2 (Interaction: F1,27 = 5.53, *p = 0.026, two-way ANOVA; *p < 0.05, Bonferroni’s post hoc test) and parvalbumin (Treatment effect: F1,24 = 4.28, *p = 0.049, two-way ANOVA). F Correlation between depressive-like behavior and level of Pvalb expression in the hippocampus after social isolation (left; 24 weeks of age; R = −0.55, p = 0.03) and OSFST protocols (right; 10 weeks of age; R = −0.69, p = 0.0001). The dotted lines represent the 95% confidence interval of the linear regression line. G Scheme of potential relation between GAD expression level, energy metabolite binding and enzyme activity.

