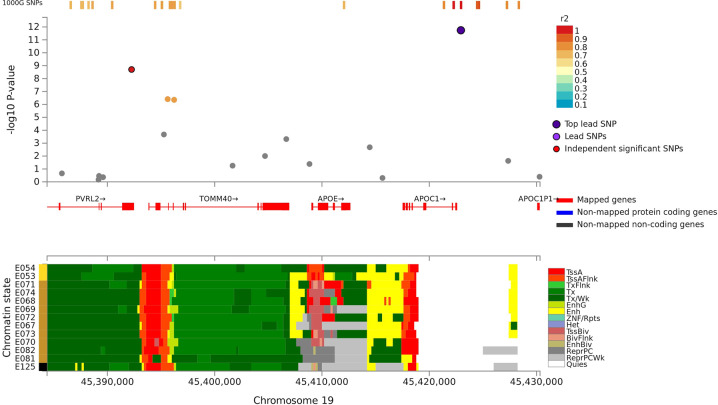
Fig. 3.
Regional plot of associations of SNPs at the 19q13.3 region with verbal learning (Upper panel). Dots indicate p values of SNPs and the top lead SNP rs4420638 is marked in violet and another independent and significant SNP rs6857 is marked in red. Lower panel indicates 15-core chromatin state in Roadmap brain-related tissues (E053-E082) and E125 ENCODE NH-A Astrocytes primary cells and shows that both significant SNPs are in or flanking transcriptionally active region.

