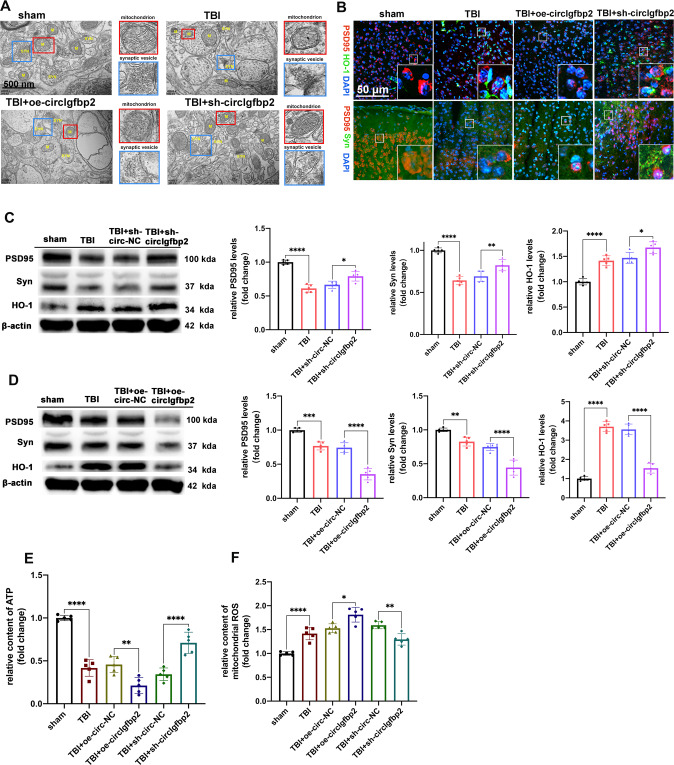
Fig. 3. Knockdown of circIgfbp2 alleviates brain injury after TBI, while overexpression of circIgfbp2 reverses this process.
A The effect of circIgfbp2 overexpression or knockdown on the brain ultrastructure three days after TBI. TEM photomicrographs showed the changes in mitochondria and synaptic vesicles in the different groups. The red boxed regions indicated mitochondria, while the blue boxed regions indicated synaptic vesicles. B The co-localization of PSD95 with HO-1 or Syn was detected by double immunofluorescence in sham, TBI, TBI + oe-circIgfbp2, TBI + sh-circIgfbp2 group. C The expression of PSD95, Syn and HO-1 after circIgfbp2 knockdown in mice at 3 days after TBI by Western blot. n = 5 per groups, PSD95: TBI vs. sham, ****p < 0.005, TBI + sh-circIgfbp2 vs. TBI + sh-circ-NC, *p < 0.05; Syn: TBI vs. sham, ****p < 0.0001, TBI + sh-circIgfbp2 vs. TBI + sh-circ-NC, **p < 0.01; HO-1: TBI vs. sham, ****p < 0.0001, TBI + sh-circIgfbp2 vs. TBI + sh-circ-NC, *p < 0.05. One-way ANOVA followed by Tukey’s multiple comparisons test. D The expression of PSD95, Syn and HO-1 after circIgfbp2 overexpression in TBI mice at 3 days by Western blot. n = 5 mice per group, PSD95: TBI vs. sham, ***p < 0.001, TBI + oe-circIgfbp2 vs. TBI + oe-circ-NC, ****p < 0.0001; Syn: TBI vs. sham, **p < 0.001, TBI + oe-circIgfbp2 vs. TBI + oe-circ-NC, ****p < 0.0001; HO-1: TBI vs. sham, ****p < 0.0001, TBI + oe-circIgfbp2 vs. TBI + oe-circ-NC, ****p < 0.0001. One-way ANOVA followed by Tukey’s multiple comparisons test. E The content of ATP of circIgfbp2 overexpression or knockdown mice after TBI, n = 5 mice per group. TBI vs. sham, ****p < 0.0001, TBI + oe-circIgfbp2 vs. TBI + oe-circ-NC, **p < 0.01,TBI + sh-circIgfbp2 vs. TBI + sh-circ-NC, ****p < 0.0001.One-way ANOVA followed by Tukey’s multiple comparisons test. F The content of mitochondrial ROS of circIgfbp2 overexpression or knockdown in mice at 3 days after TBI, n = 5 mice per group. TBI vs. sham, ****p < 0.0001, TBI + oe-circIgfbp2 vs. TBI + oe-circ-NC, *p < 0.05, TBI + sh-circIgfbp2 vs. TBI + sh-circ-NC, **p < 0.01.One-way ANOVA followed by Tukey’s multiple comparisons test. All data were represented as mean ± SEM.

