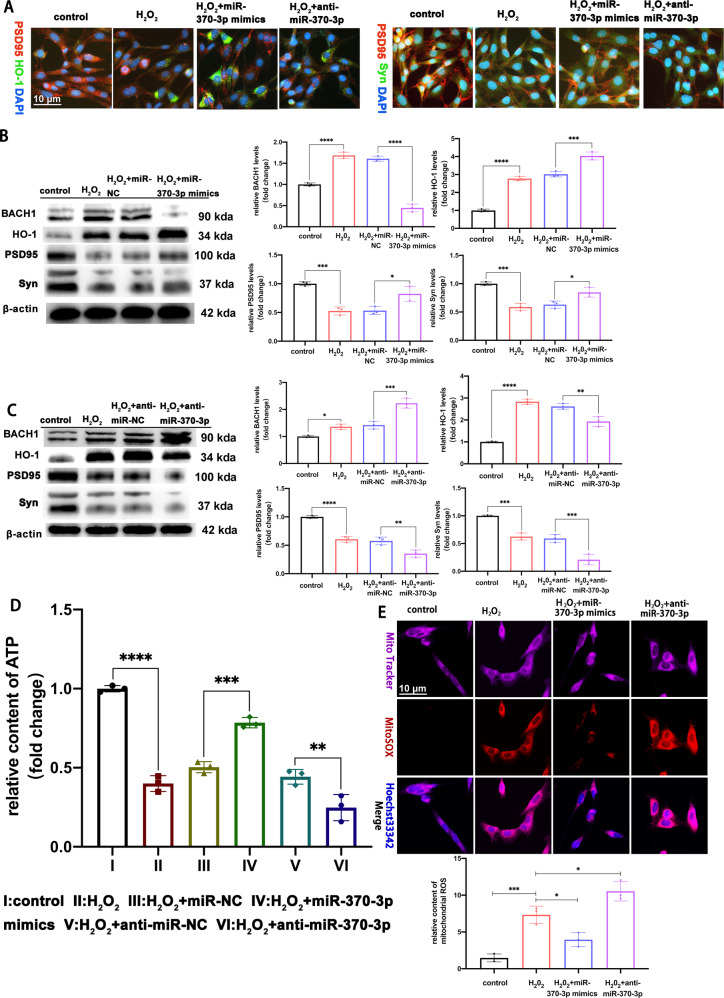
Fig. 5. miR-370-3p regulates BACH1 to alleviate mitochondrial dysfunction and oxidative stress-induced synapse dysfunction.
A The double immunofluorescence staining showed the colocalization of PSD95 and HO-1, PSD95 and Syn in control, H2O2, H2O2 + miR-370-3p mimics, and H2O2 + anti-miR-370-3p group. B The expression of BACH1, HO-1, PSD95 and Syn proteins were analyzed in the HT22 cells transduced with miR-NC or miR-370-3p mimics for 48 h and treated with H2O2 (600 µmol/L) for 6 h by Western blot, n = 3 replication. BACH1: H2O2 vs. control, ****p < 0.0001, H2O2 + miR-370-3p mimics vs. H2O2 + miR-NC, ****p < 0.0001,;HO-1: H2O2 vs. control, ****p < 0.0001, H2O2 + miR-370-3p mimics vs. H2O2 + miR-NC, ***p < 0.001,;PSD95: H2O2 vs. control, ***p < 0.001, H2O2 + miR-370-3p mimics vs. H2O2 + miR-NC, *p < 0.05; Syn: H2O2 vs. control, ***p < 0.001, H2O2 + miR-370-3p mimics vs. H2O2 + miR-NC, *p < 0.05. One-way ANOVA followed by Tukey’s multiple comparisons test. C The expression of BACH1, HO-1, PSD95 and Syn were analyzed in the HT22 cells transduced with anti-miR-NC or anti-miR-370-3p for 48 h and treated with H2O2 (600 µmol/L) for 6 h by Western blot, n = 3 replications.BACH1: H2O2 vs. control, *p < 0.05, H2O2 + anti-miR-370-3p vs. H2O2 + anti-miR-NC, ***p < 0.001;HO-1; H2O2 vs. control, ****p < 0.0001,H2O2 + anti-miR-370-3p vs. H2O2 + anti-miR-NC, **p < 0.01; PSD95: H2O2 vs. control, ****p < 0.0001, H2O2 + anti-miR-370-3p vs. H2O2 + anti-miR-NC, **p < 0.01; Syn: H2O2 vs. control, ***p < 0.001, H2O2 + anti-miR-370-3p vs. H2O2 + anti-miR-NC, ***p < 0.001. One-way ANOVA followed by Tukey’s multiple comparisons test. D The content of ATP with miR-370-3p overexpression or knockdown in HT22 cells treated with H2O2 (600 µmol/L) for 6 h, n = 3 replications.H2O2 vs. control, ****p < 0.0001, H2O2 + miR-370-3p mimics vs. H2O2 + miR-NC, ***p < 0.001, H2O2 + anti-miR-370-3p vs. H2O2 + anti-miR-NC, **p < 0.01. One-way ANOVA followed by Tukey’s multiple comparisons test. E Representative fluorescent staining of Mitosox for mitochondrial ROS with miR-370-3p overexpression or knockdown in HT22 cells treated with H2O2 (600 µmol/L) for 6 h, and quantitative analysis of the mean optical density analysis of Mitosox, n = 3 replications. H2O2 vs. control,***p < 0.001,H2O2 + miR-370-3p mimics vs. H2O2, *p < 0.05,H2O2 + anti-miR-370-3p vs. H2O2, *p < 0.05, one-way ANOVA followed by Tukey’s multiple comparisons test. All data were represented as mean ± SEM.

