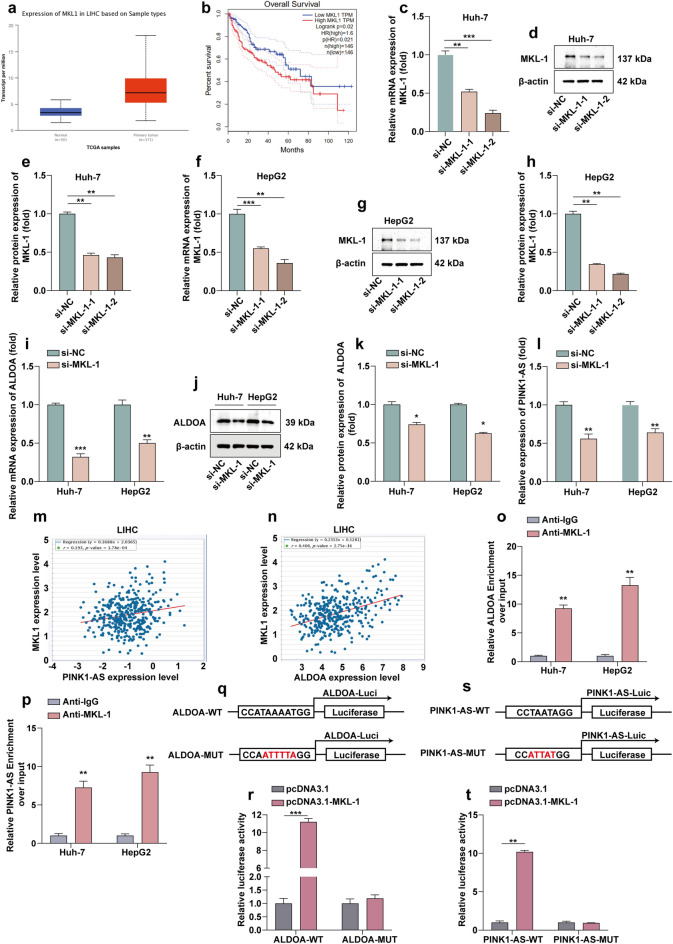
Figure 6.
MKL-1 induces the expression of PINK1-AS and ALDOA as a transcription factor. (a) The box diagram shows the level of MKL-1 mRNA in the Ualcan database (http://ualcan.path.uab.edu/analysis.htm). (b) Kaplan–Meier survival curves showing the effect of MKL-1 on overall survival. (c–h) WB and RT-qPCR to verify the efficiency of siRNA knockdown of MKL-1. Statistical data are shown. (i,g,k) WB and RT-qPCR to determine the expression level of ALDOA in Huh-7 and HepG2 cells after knockdown of MKL-1. Statistical data are shown. (l) RT-qPCR determination of PINK1-AS expression levels in Huh-7 and HepG2 cells after knockdown of MKL-1. (m,n) Correlation analysis showed that MKL-1 was positively correlated with the expression of ALDOA and PINK1-AS (P < 0.001). (o,p) Quantitative ChIP analysis to show direct binding of MKL-1 to the endogenous PINK1-AS and ALDOA promoter regions. (q,r) Prediction of MKL-1 binding sites in the human PINK1-AS and ALDOA promoters by gene sequence analysis. (s,t) Luciferase reporter gene test to detect whether MKL-1 can target the PINK1-AS and ALDOA promoters. *P < 0.05; **P < 0.01; ***P < 0.001.

