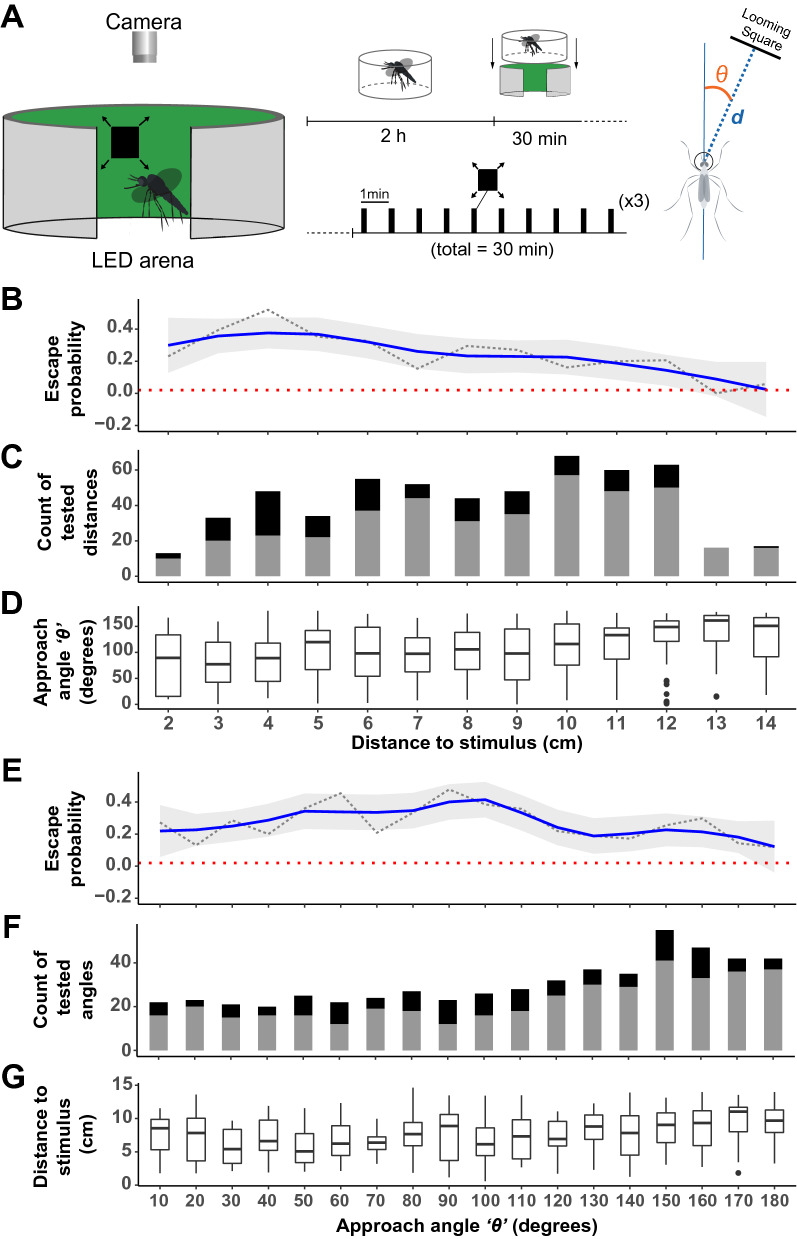
Figure 3.
Escape probability as a function of the distance and direction of the stimulus. (A) Schematic of the experimental apparatus (left) and graphical representation of the experiment’s timeline (middle) where an individual female mosquito is isolated in a clear cylinder 2 h before the start of the experiments. The cylinder is positioned in the LED arena and the mosquito is provided 30 min to acclimatize to the conditions before being stimulated with a looming square every minute for 30 min. For each stimulus introduction, the angle of approach θ and the distance between the head of the mosquito and the center stimulus were measured (Right). (B,E) Mosquitoes’ probability to escape (take-off) after introduction of the expanding stimuli, represented as a function of the distance to the point of stimulus introduction (B) or as a function of the direction of stimulus introduction, i.e., approach angle (E). A trendline (solid, blue) from a single-term linear model fit with 95% confidence interval (gray) summarizes the relationship between escape probability (doted, black) and the predictor variables. The dotted horizontal line (red) denotes the baseline escape probability (take-off) in the absence of any expanding stimuli. (C,F) Number of experimental trials categorized based on mosquitoes response (black) and lack of response (gray) after introduction of the expanding stimuli. (D) Distribution of the approach angle θ (degrees) i.e., angle at which the stimulus is introduced relative to the mosquito’s body orientation, across distance bins. (G) Distribution of the mosquitoes’ distance from the point of stimulus introduction (cm) across bins of approach angles. In (B–D), the response variables are visualized as a function of the mosquitoes’ distance from the point of stimulus introduction (0–14.63 cm) represented as a categorical variable, i.e., 1 cm per category. In (E–G), the response variables are visualized as a function of the approach angle θ (0°–180°, where 0° is to the front and 180° is behind the mosquito) represented as a categorical variable, i.e., 10° per category.

