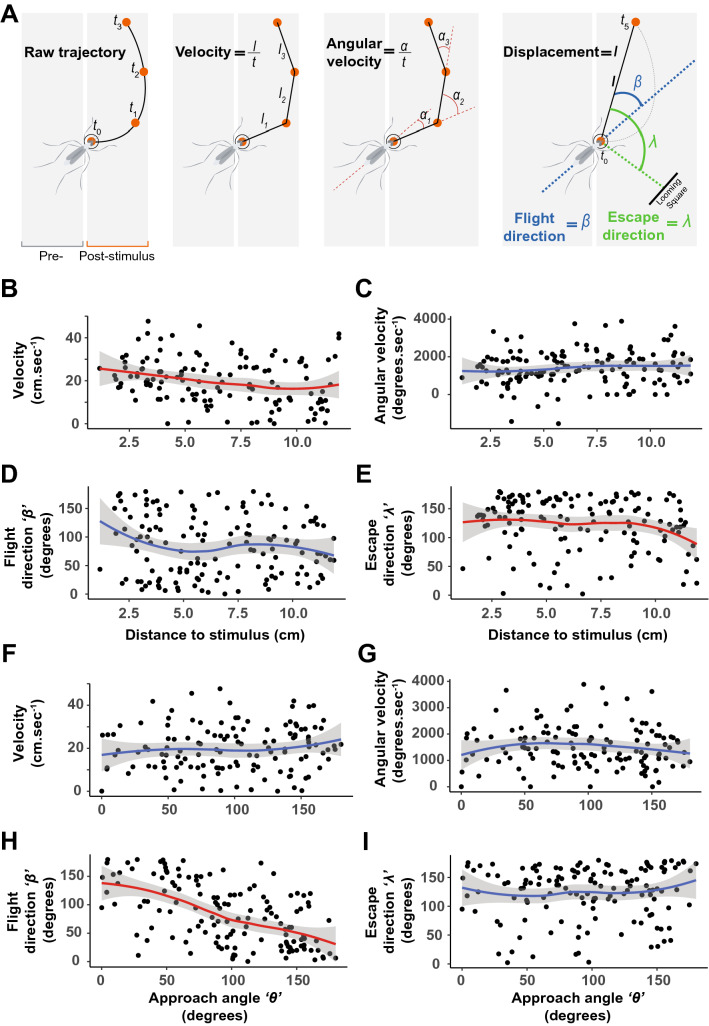
Figure 5.
Statistical analysis of the escape strategy displayed by mosquitoes. (A) Illustrations of the mosquitoes’ responses quantified as (B,F) velocity (cm.s−1), (C,G) angular velocity (degrees.s−1), (D,H) flight direction, β (degrees) i.e., the direction of escape relative to the mosquito’s body orientation, (E,I) escape direction, λ (degrees) i.e., the direction of escape relative to the stimulus, and displacement (see Supplementary Fig. S5). In (B–E), the response variables are visualized as a function of the mosquitoes’ distance to the stimulus (0–11.89 cm). In (F–I), the response variables are visualized as a function of the ‘approach angle’ θ, where 0° is in front of the mosquito and 180° is behind the mosquito. In (D,H), a β angle of 0° indicates a forward flying mosquito and 180° indicates a backward flying mosquito. In (B–I), a trend line from a single-term local regression model fit with 95% confidence interval (gray shaded area) summarizes the relationship between the response and predictor variables. Red trend lines indicate significant effects of the predictive factors (distance to stimulus or angle of stimulus introduction, respectively) on the response variables, and blue trend lines indicate non-significant effects (generalized linear models, α = 0.05).

