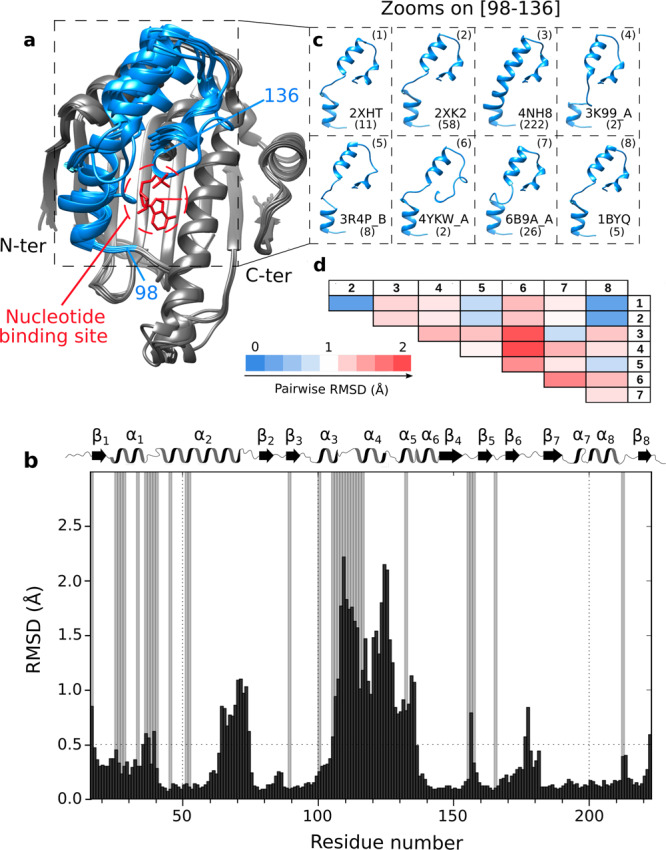
Fig. 1. Analysis of available structures of human HSP90α-NTD.

a Superimposition of 8 centroids representing the 8 clusters describing the 334 structures of isolated HSP90α-NTD available in the Protein Data Bank (on January the 5th of 2021). Clustering was performed using the MaxCluster program (http://www.sbg.bio.ic.ac.uk/maxcluster) with an Average Linkage type of hierarchical clustering and a threshold value of 1.05. In blue is depicted the segment [98–136] and in red the nucleotide. b Histogram of the averaged pairwise RMSD between Cα backbone atoms of the 8 centroids in Å as a function of the residue number (black). Grey bars represent non-assigned backbone residues49. On top of the histogram: secondary structure elements as a function of the residue number (α for helices and β for sheets). c Zooms on the segment [98–136], that shows the highest structural variability, for all the 8 centroids superimposed using the Chimera MatchMaker command. PDB ID and a number of structures present in each cluster are disclosed next to each centroid. d Table representing pairwise RMSD in Å between Cα backbone atoms belonging to the segment [98–136] of each pair of the 8 centroids superimposed using Chimera MatchMaker command (PDB IDs: 1: 2XHT, 2: 2XK2, 3: 4NH8, 4: 3K99_A, 5: 3R4P_B, 6: 4YKW_A, 7: 6B9A_A, 8: 1BYQ). Going from blue to red the RMSD values increase. Centroids from clusters (1), (2), and (8) are highly similar (low pairwise RMSD values) on the segment [98–136], but these three centroids differ mainly on another segment of the protein [64–75].
