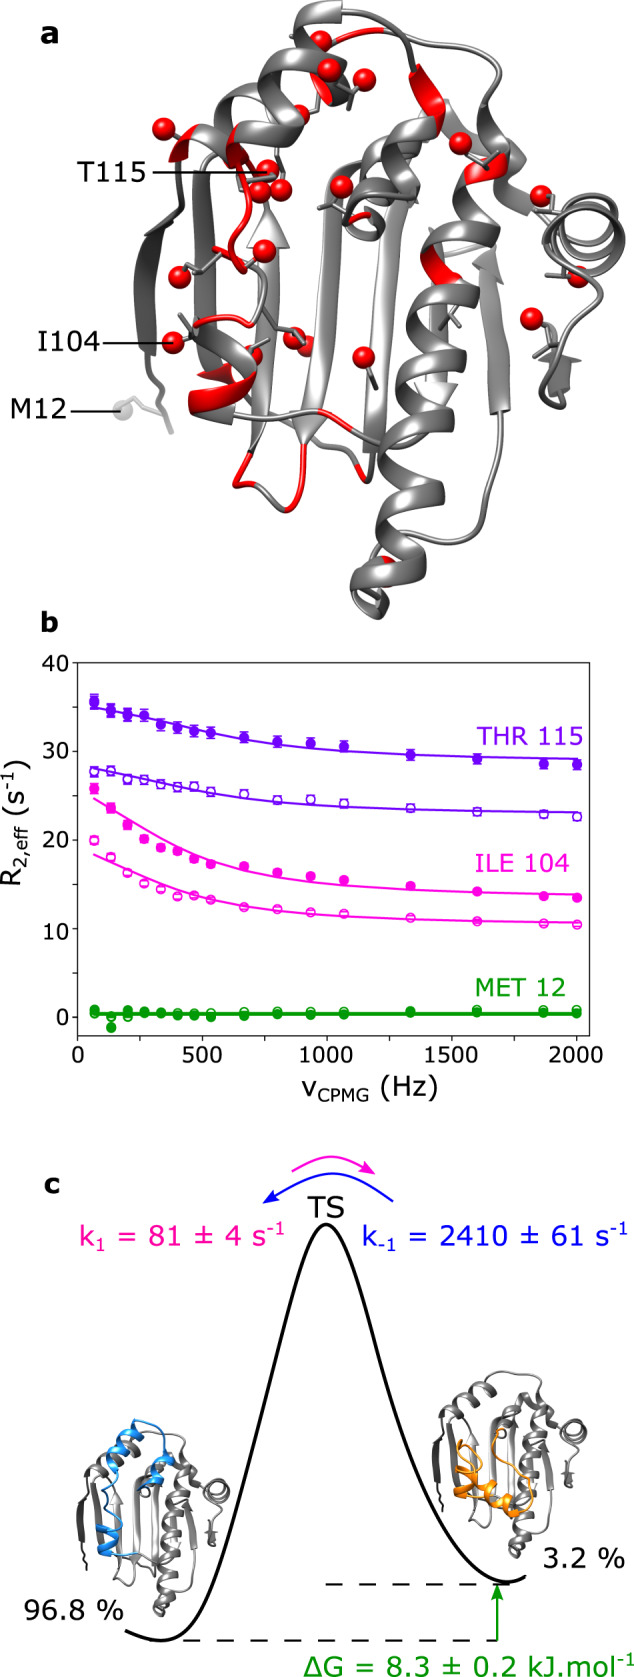
Fig. 5. Relaxation dispersion study of HSP90α-NTD.

a 3D structure of human HSP90α-NTD displaying in red methyl- and backbone 15N- probes for which conformational exchange in the μs-ms time scale was detected. b Examples of 13CH3 MQ CPMG relaxation dispersion profiles of Thr-115, Ile-104 and Met-12 plotted in purple, pink and green, respectively. The filled circles for each color represent data acquired at 850 MHz, and the empty circles represent data acquired at 700 MHz. Data displayed were acquired at 293 K using a U-[2H, 15N, 12C], Ala-[13C1H3]β, Ile-[13C1H3]δ1, Leu-[13C1H3]δ2, Met-[13C1H3]ε, Thr-[13C1H3]γ, Val-[13C1H3]γ2 HSP90-NTD sample. Experimental data were fitted to a two-sites exchange model (global fit of 21 relaxation dispersion curves). Errors for R2,eff rate values were estimated from twice the noise measured in the spectra. However, when errors were less than 2% of the R2,eff rate value, an error of 2% was assumed. c Schematic diagram of the energy landscape for the exchange between the ATP-lid open (ground) and closed (excited) states of HSP90α-NTD. Both thermodynamics and kinetics parameters of the exchange, extracted at 293 K, are displayed. Activation energies can be estimated using Eyring equation (assuming that the transmission coefficient κ is 1). From the ground state to the transition state: ΔG‡ = 61.0 ± 0.2 kJ.mol−1 and from the excited state to the transition state: ΔG‡ = 52.7 ± 0.1 kJ.mol−1. The precision on the data was estimated using Monte Carlo.
