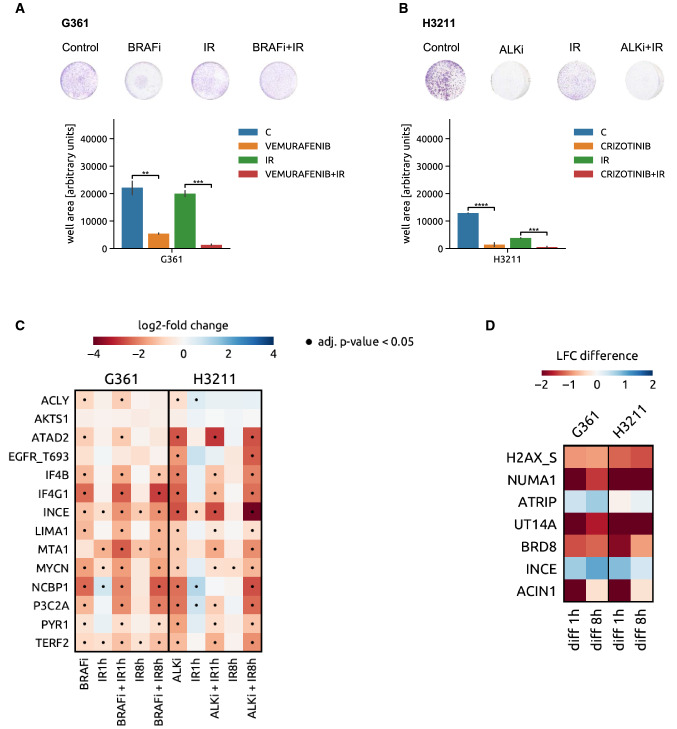
Fig. 4.
Oncogene targeting-induced responses in ALK- and BRAF-addicted models. A Viability of the BRAF V600E-expressing melanoma cell line model G361 upon BRAF inhibition (vemurafenib), IR and their combination (upper panel—representative pictures, lower panel—crystal violet quantification (Student t-test, **P < 0.01; ***P < 0.001). B Viability of EML4-ALK translocated NSCLC cell line H3211 upon ALK inhibition by crizotinib, IR and their combination (upper panel—representative pictures, lower panel—crystal violet quantification (Student t-test, ***P < 0.001, ****P < 0.0001). C Heat map of changes in abundance of phosphopeptides that compose the MET oncogene addiction phosphosignature in G361 and H3211 cells upon inhibition of BRAF and ALK, respectively, IR and the combination of the two modalities. Blue, upregulated phosphopeptides. Red, downregulated phosphopeptides. Dot, adjusted p-value < 0.05. D BRAF and ALK inhibitor-induced modulation (in G361 and H3211 cells, respectively) of DDR-related phosphopeptides that were identified in MET-addicted systems as significantly differently regulated between IR and METi + IR condition (Fig. 2C). The heat map shows a comparison of the phosphorylation levels between BRAFi + IR versus IR alone in the G361 cells (left part) and ALKi + IR versus IR in the H3211 cell line (right panel)

