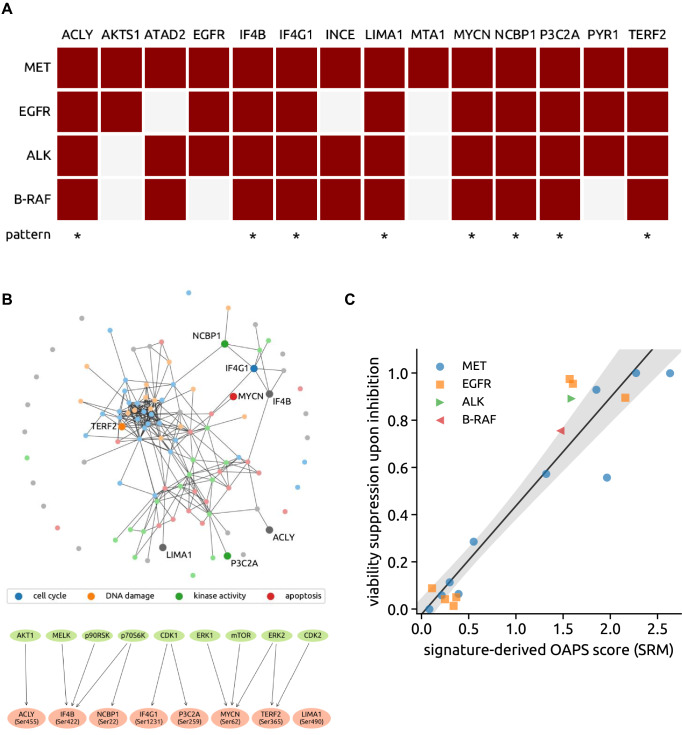
Fig. 5.
Oncogene addiction phosphorylation signature (OAPS) and the OAPS-derived score. A Map of phosphorylation changes elicited by oncogene inhibition in MET-, EGFR-, ALK- and BRAF-addicted cell systems. The 8 phosphopeptides-containing signature shared by all of these models of addiction (oncogene addiction phosphorylation signature, OAPS) is visualized in the last row. (Dark red box, downregulation of phosphorylation detected upon inhibition of the respective addicting oncoprotein, white box, significant phosphorylation change not observed.) B Upper panel: visualisation of the OAPS-included proteins and their main GO terms cellular functions within the network of all tested phosphopeptides. (GO terms: blue—cell cycle, orange—DNA damage, green—kinase activity, red—apoptosis, gray—other) Lower panel: OAPS phosphosites’s upstream kinases. C The viability suppression upon inhibition highly correlates with the signature-derived score computed from phosphoproteomics in cell line systems (correlation 0.94, p-value 3 × 10⁻¹⁰). The solid line and the shaded area show the linear regression result (intercept − 0.02, slope 0.46, p-value 3 × 10⁻⁹) and its uncertainty (95% CI)

