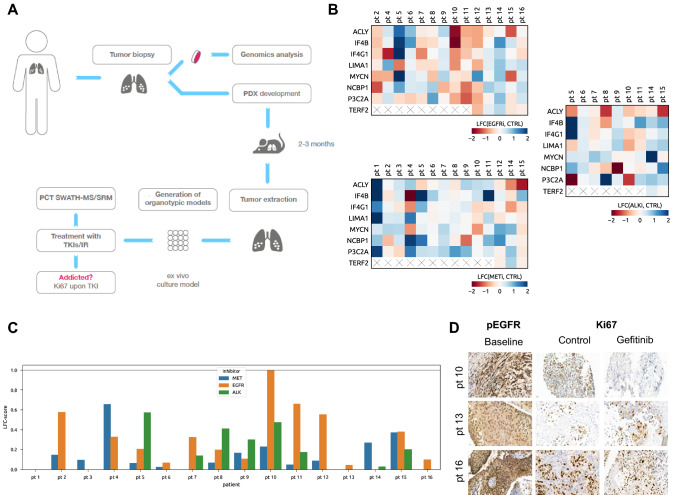
Fig. 6.
Validation of the oncogene addiction phosphorylation signature (OAPS) in NSCLC tissues. A Schematic workflow of the OAPS analysis by SRM in NSCLC tumor biopsies combining PDX models and ex vivo organotypic cultures. B Heat maps displaying OAPS changes in NSCLC patient tissues following 16 h of EGFR (gefitinib; upper left panel), MET (tepotinib; lower left panel), and ALK (crizotinib; right panel) inhibition. (LFC—log fold change in phosphorylation upon inhibition of addicting oncoprotein; cross—phosphopeptide not detected) C OAPS-derived score computed from phosphoproteomics in patient tissues (the score for up to three different inhibitors has been assessed for each patient). D Representative pictures of immunohistochemical staining (pEGFR—EGFR activation; Ki67—cell proliferation marker) of selected gefitinib-treated patient tissues (baseline—tissues stained prior start of the treatment, control—untreated tissues (OTCs) collected and stained at day 3, gefitinib—gefitinib-treated OTCs collected and stained at day 3 (48 h upon the start of EGFR inhibition)

