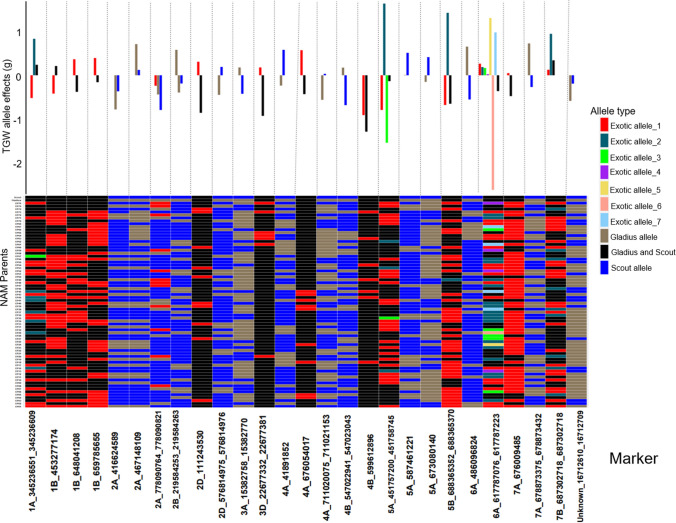
Fig. 4.
Distribution of allele effects (upper bar graph) of the detected MTA in the NAM RILs and NAM parents allele matrix showing allelic diversity in the parents for the detected MTA (lower heatmap) for TGW. For the distribution of the allele effects, each bar represents an allele, and the length of the bar denotes the size of the allele effect, and each column corresponds to the MTA detected by GWAS for TGW. Collectively, the number of bars in each column of the bar graph corresponds to the number of alleles for the respective MTA. For the allele matrix, each row corresponds to the NAM parent, each column corresponds to the MTA detected by GWAS for TGW and each cell of the heatmap denotes an allele. Allele type refers to the source of the allele; exotic allele if the allele is only found in the exotic parents and is contributed to the NAM RILs by the exotic parent(s); Gladius allele if the allele in the exotic parent(s) and the NAM RILs is the same as the allele for Gladius recurrent parent; Gladius and Scout allele if both the recurrent parents share a similar allele and the exotic parent and NAM RILs also share the similar allele as Gladius and Scout; Scout allele if the allele in the exotic parent(s) and the NAM RILs is the same as the allele for Scout recurrent parent. The exotic alleles are numbered for each MTA and denotes the amount of different exotic alleles per MTA

