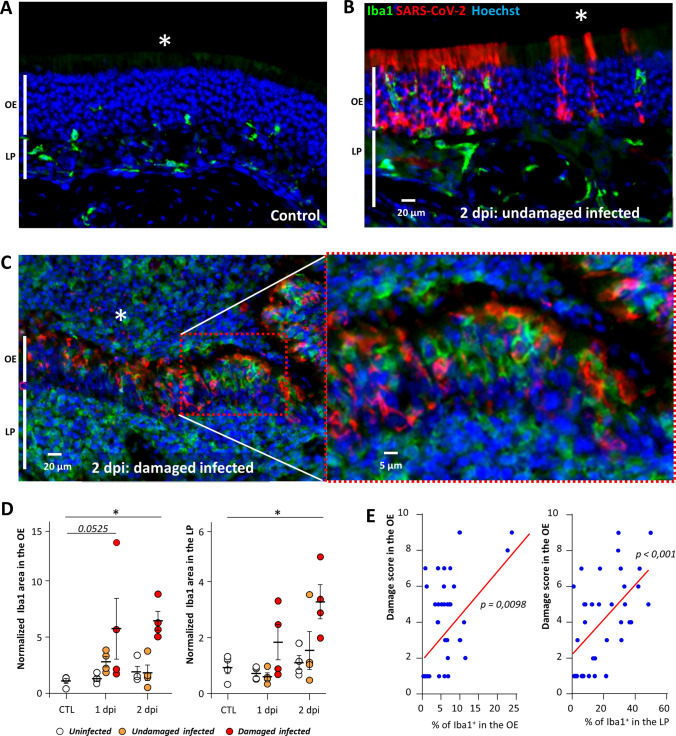
Fig. 3.
Iba1+ cell infiltration increases with the damage in the OE. Representative images of the olfactory epithelium from an uninfected animal (A), infected but undamaged (B) and infected and damaged (C) area of the olfactory epithelium (OE) at 2 days post-infection (dpi). The lumen of the nasal cavity is indicated by a white asterisk. (D) Iba1+ signal in the olfactory epithelium (OE, left) and lamina propria (LP, right) in control animals (CTL) or at 1 or 2 dpi (Mean normalized to control ± SEM, n = 4, *p < 0.01 (Mann–Whitney test)). (E) Correlation between score damage of the olfactory epithelium and the percentage of Iba1+ signal in the olfactory epithelium (left panel) and the lamina propria (right panel). Spearman test p value

