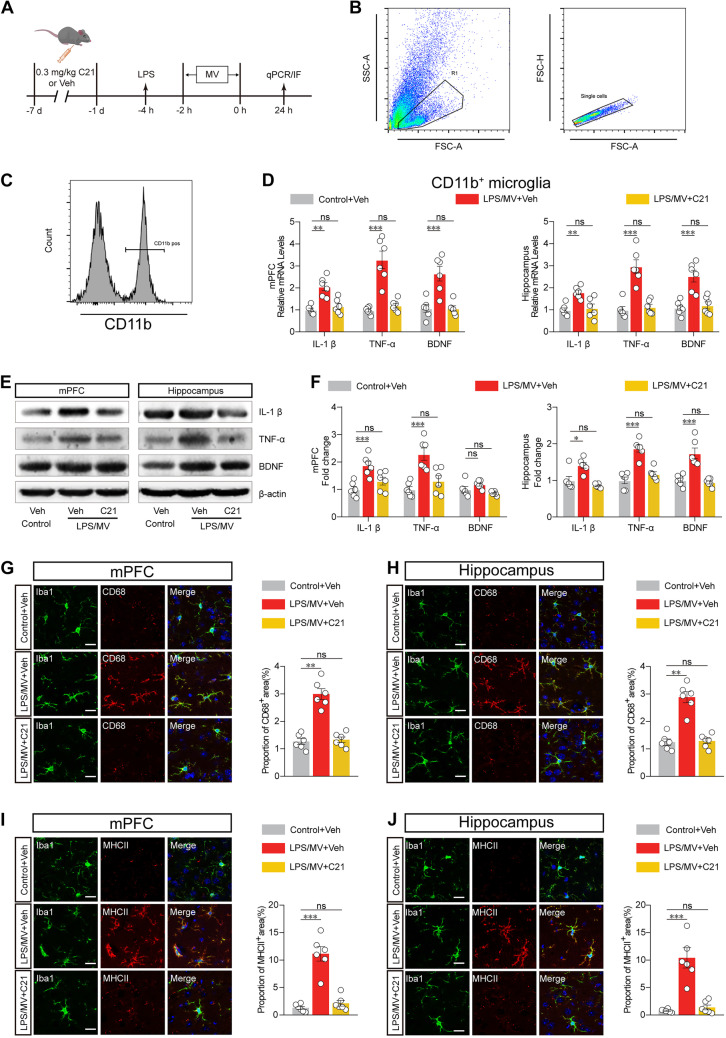
Fig. 3.
AGTR2 agonist reduces microglial functional markers and inflammatory factors. A Schematic timeline, and mice were randomly divided into three groups as control + Veh, LPS/MV + Veh, and LPS/MV + C21. B-C Workflow diagram and the scheme of flow cytometry and cell sorting. D The gene mRNA expression of IL-1 β, TNF α, and BDNF in CD11b-labelled microglia from the mPFC (left panel) and hippocampus (right panel). E Western blot analysis of IL-1 β, TNF α, and BDNF protein levels in the mPFC (left panel) and hippocampus (right panel). F Semi-quantification for different proteins expression were normalized in the mPFC (left panel) and hippocampus (right panel). G Representative images (left panel) and analysis results (right panel) of CD68 in Iba1+ cell from the areas of mPFC. Scale bar, 20 μm. H Representative images (left panel) and analysis results (right panel) of CD68 in Iba1 + cell from the areas of hippocampus. Scale bar, 20 μm. I Representative images (left panel) and quantitative analysis (right panel) of MHCII in the areas of mPFC. Scale bar, 20 μm. J Representative images (left panel) and quantitative analysis (right panel) of MHCII in the areas of hippocampus. Scale bar, 20 μm. All data were presented as mean ± SEM. * p < 0.05; ** p < 0.01; *** p < 0.001; ns, not significant. For detailed statistics information, see Table S1

