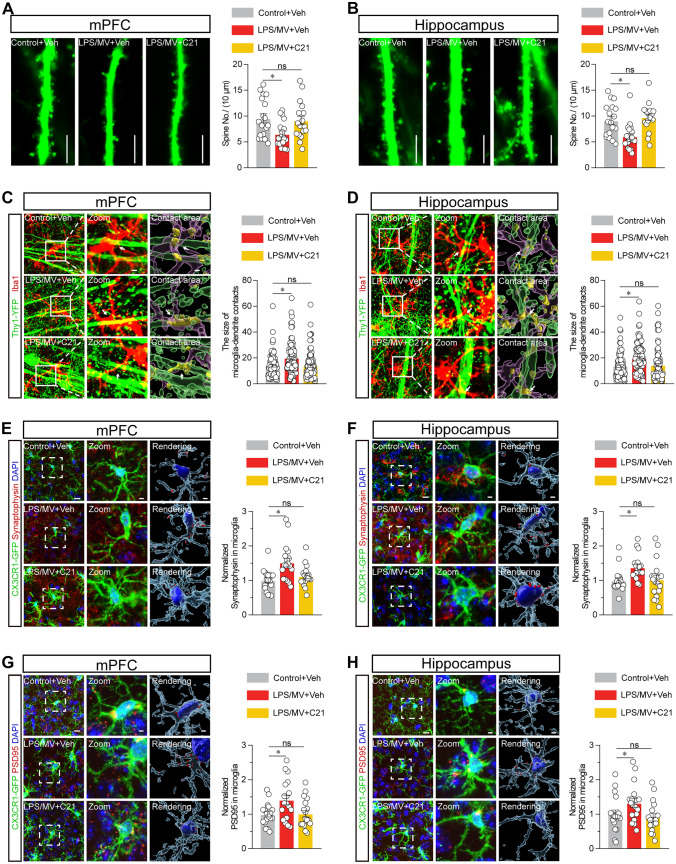
Fig. 4.
AGTR2 agonist reduces microglial engulfment of neuronal spines and phagocytosis of synapses. A Representative images of neuronal dendrites (left panel) and summarized data for spine numbers per 10 μm (right panel) were displayed in the mPFC from Thy1-YFP mice. Scale bar, 10 μm. B Representative images of neuronal dendrites (left panel) and summarized data for spine numbers per 10 μm (right panel) were displayed in the hippocampus from Thy1-YFP mice. Scale bar, 10 μm. C Reconstructed images of Iba1+ microglia (red) and YFP+ neuronal dendrites (Thy1-YFP mice) (left panel), and summarized data for the size of microglia-dendrite contacts (right panel) in the mPFC. Scale bars, 5 μm (overview) and 2 μm (inset). D Reconstructed images of Iba1+ microglia (red) and YFP+ neuronal dendrites (Thy1-YFP mice) (left panel), and summarized data for the size of microglia-dendrite contacts (right panel) in the hippocampus. Scale bars, 5 μm (overview) and 2 μm (inset). E Representative images and 3D surface rendering of Iba1+ microglia containing synaptophysin puncta (left panel), and quantification of synaptophysin puncta in microglia (right panel) in the mPFC as indicated. Scale bars, 10 μm (overview) and 2 μm (inset and rendering). F Representative images and 3D surface rendering of Iba1+ microglia containing synaptophysin puncta (left panel), and quantification of synaptophysin puncta in microglia (right panel) in the hippocampus as indicated. Scale bars, 10 μm (overview) and 2 μm (inset and rendering). G Representative images and 3D surface rendering of Iba1+ microglia containing PSD95+ puncta (left panel), and quantification of PSD95+ puncta in microglia (right panel) in the mPFC as indicated. Scale bars, 10 μm (overview) and 2 μm (inset and rendering). H Representative images and 3D surface rendering of Iba1+ microglia containing PSD95+ puncta (left panel), and quantification of PSD95 + puncta in microglia (right panel) in the hippocampus as indicated. Scale bars, 10 μm (overview) and 2 μm (inset and rendering). All data were presented as mean ± SEM. * p < 0.05, ** p < 0.01, and *** p < 0.001; ns, not significant. For detailed statistics information, see Table S1

