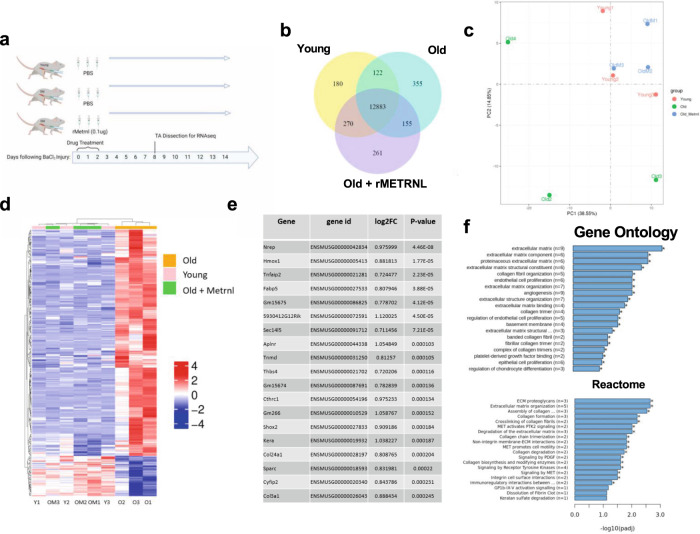
Fig. 4. rMetrnl rejuvenates the transcriptional profile of aged muscle regeneration.
a Graphical representation of experimental design (n = 3/group). b Venn Diagram of co-expressed transcripts between groups. c 2D Graphical representation of principal component analysis showing top two principal components of transcriptomic data. d Heatmap and dendrogram of transcript (y axis) expression level compared to mean expression across all groups (colormap) from each sample (x axis). e Top transcripts ranked by significance and log fold change when differential expression analysis was performed between old and old+rMetrnl groups; two-tailed t test was performed between old and old+rMetrnl and FDR adjusted to determine p value. f Gene set enrichment analysis performed to determine p values between old and old+rMetrnl groups specifically using Gene Ontology (Biological Processes) and Reactome databases. Graphics created with BioRender.com. Source data are available through GEO Accession ID GSE217037.

