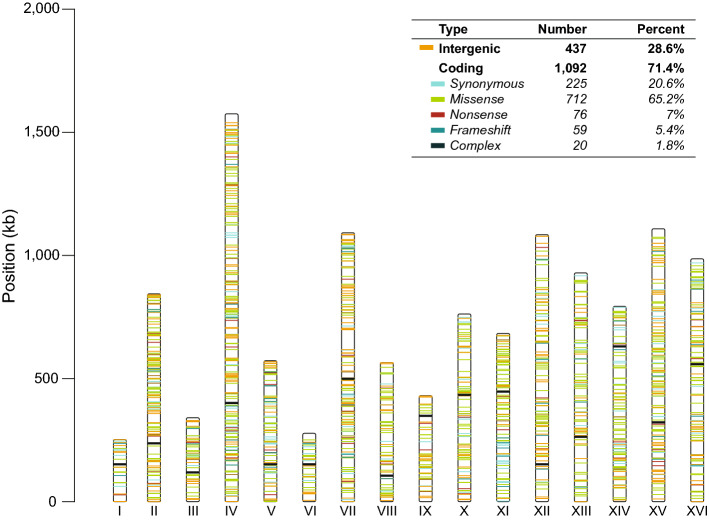
Fig. 2.
The spectrum of mutations in 96 evolved clones under galactose evolution. Distribution of 1,529 unique evolved mutations across 16 Chromosomes. The vertical bars represent each Chromosome labeled by Roman numeral. The horizontal lines reflect each mutation colored based upon their protein-coding effect (top box). Other mutations group conservative inframes, disruptive inframes, and complex mutations. Centromers are represented with a black horizontal line

