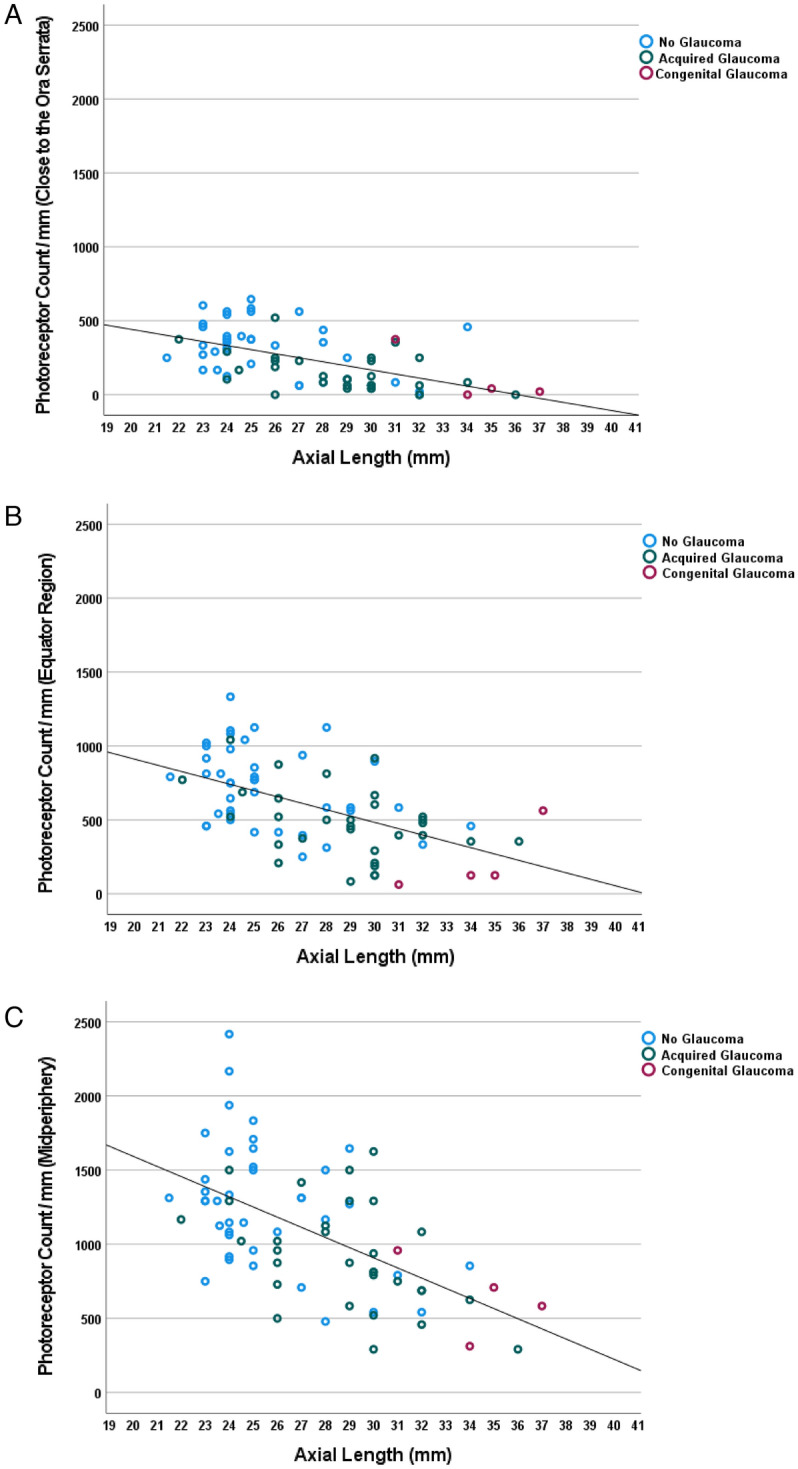
Figure 3.

Scattergram showing the distribution of the retinal photoreceptor cell count / mm in relationship to axial length, as measured close to the ora serrata (a), at the equator (b) and in the fundus midperiphery (midpoint between equator and posterior pole) (c). (a) Equation of the regression line: Photoreceptor Count/mm = − 28.8 × Axial Length (mm) + 1033. (b)Euation of the regression line: Photoreceptor Count/mm = − 44.5 × Axial Length (mm) + 1819. (c) Equation of the regression line: Photoreceptor Count/mm = − 69.8 × Axial Length (mm) + 2994.
