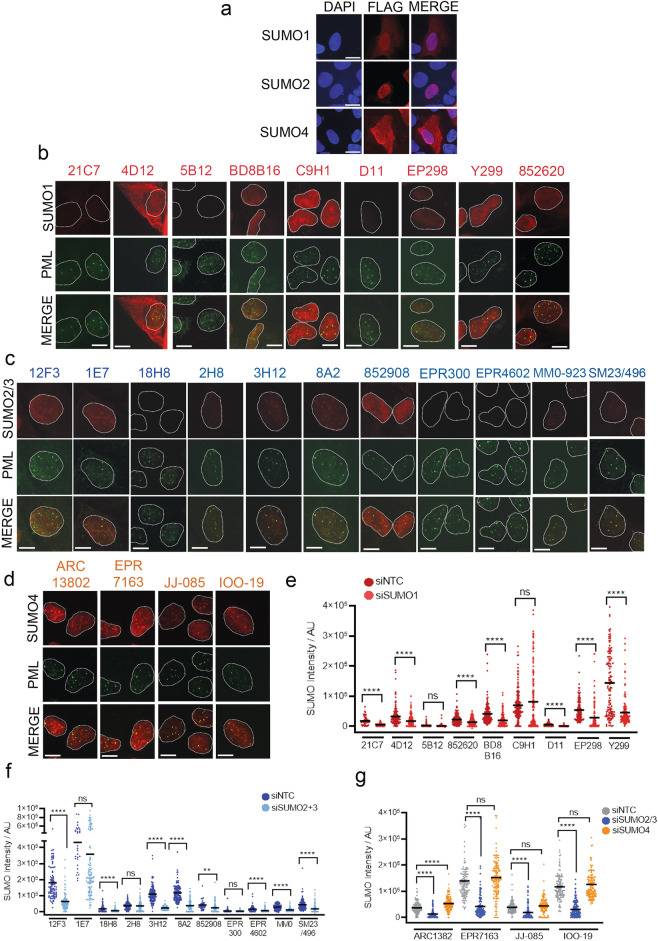
Figure 5.
SUMO MAbs as detection tools for subcellar microscopy. (a) Detection of exogenous FLAG-SUMO1, FLAG-SUMO2 and FLAG-HA SUMO4 in U2OS by indirect immunofluorescence using anti-FLAG antibodies. Scale bar = 10 µm. (b) U2OS cells stained with indicated anti-SUMO1 MAb (red) and PML (green). Mouse and Rat SUMO1 MAbs (21C7, 4D12, 5B12, BD8B16, D11 and 852620) were co-stained with Rabbit PML antibody and Rabbit SUMO1 MAbs were co-stained with Mouse PML antibody. Scale bar = 10 µm. To improve visibility brightness was increased by 20% across all panels. (c) Cells stained as for (b), using anti-SUMO2/3 MAbs. To improve visibility brightness was increased by 20% across all panels. (d) Cells stained as for (b) using anti-SUMO4 MAbs. (e) Quantification of SUMO1 MAb intensity signal per whole cell treated with either control (siNTC) or SUMO1 (siSUMO1) siRNA for 72 h prior to fixation. Two-tailed t-test denotes statistical differences between siNTC and siSUMO1. N = ~ 100 cells per condition. (f) Quantification of the anti-SUMO2/3 MAb signals in the presence and absence of SUMO2 + 3 siRNA. N = ~ 100 cells per condition. (g) Quantification of the anti-SUMO4 MAb signals in the presence and absence of SUMO2 + 3 and SUMO4 siRNA. N = ~ 100 cells per condition.

