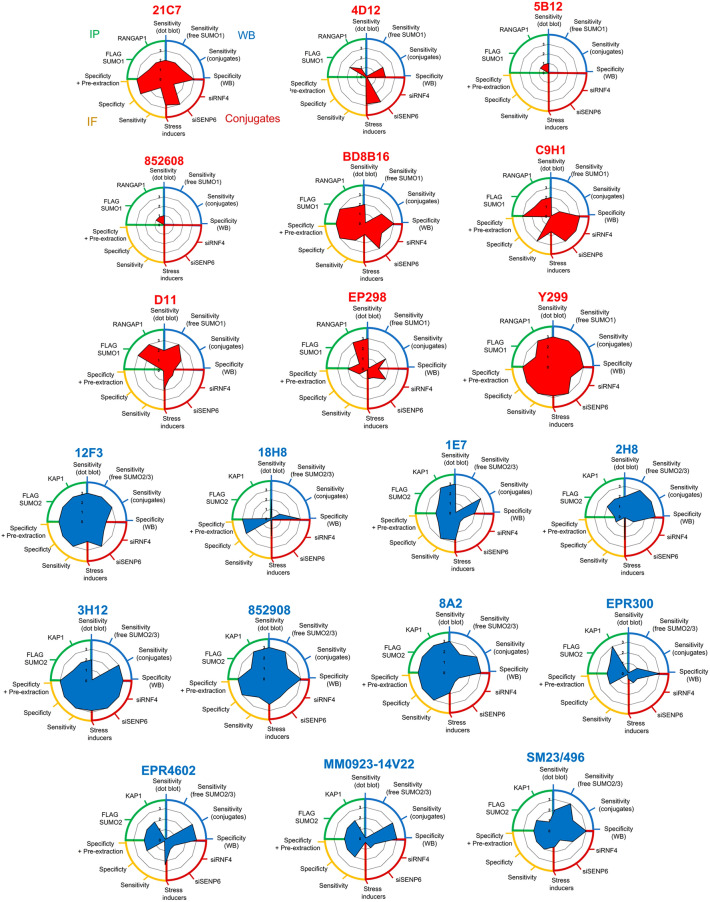
Figure 7.
Summary of SUMO MAb performance across multiple applications. Radar plots of SUMO1 (Red) and SUMO2/3 (Blue) MAbs summarising the relative performance for each application tested. Performance is rated from 1 to 3 (low, medium or high), to criteria detailed in the relative quantification section of the materials and methods. Each application is grouped as follows in a clockwise orientation. Blue; performance by immunoblot; dot blot sensitivity, sensitivity (free SUMO), sensitivity (conjugates) and specificity (reduction in conjugates on siSUMO treatment). Red; change in conjugate intensity on siRNF4/siSENP6 treatment, change in conjugates (relative to untreated) for stress inducers summarised as a mean across all tested stresses to give an indication of the dynamics of SUMO conjugates detected following stress. Yellow; indirect immunofluorescence performance on fixed cells; sensitivity (signal intensity), specificity (reduction in the signal by siRNA treatment in both −/+ pre-extraction conditions). Green; immunoprecipitation performance against FLAG-SUMO and RANGAP-1 (SUMO1 MAbs) or KAP1 (SUMO2/3 MAbs).

