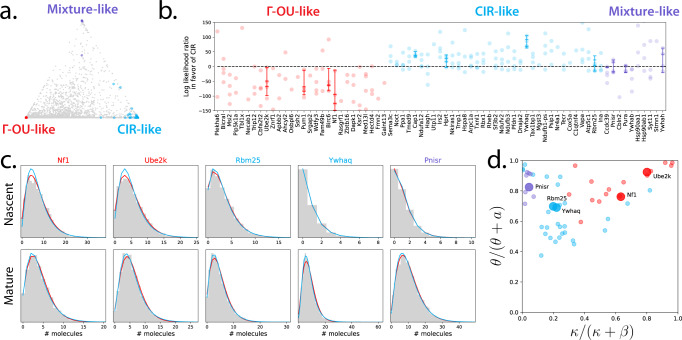
Fig. 4. Genes from comparable single-cell RNA sequencing datasets can be consistently assigned to a particular biophysical model of transcription.
a By fitting models in the limiting regimes and calculating model Akaike weights, visualized on a ternary diagram, we can obtain coarse gene model assignments (colors: regimes predicted by the partial fit; red: Γ-OU-like genes; blue: CIR-like genes; violet: mixture-like genes; gray: genes not consistently assigned to a limiting regime). b Likelihood ratios for selected genes are consistent across biological replicates, and favor categories consistent with predictions (colors: regimes predicted by the partial fit; points: likelihood ratios; horizontal line markers: Bayes factors; vertical lines: Bayes factor ranges; Bayes factor values beyond the plot bounds have been omitted. n = 4 biologically independent animals, with 5343, 6604, 5892, and 4497 cells per animal). c The differences between model best fits are reflected in raw count data (title colors: predicted regimes; lines: model fits at maximum likelihood parameter estimates; line colors: models; histograms: count data). d Non-distinguishable genes tend to lie in the slow-reversion and high-gain parameter regime; distinguishable genes vary more, but tend to have relatively high gain (colors: predicted regimes, large dots: genes illustrated in panel (c). Genes with absolute log-likelihood ratios above 150 have been excluded).

