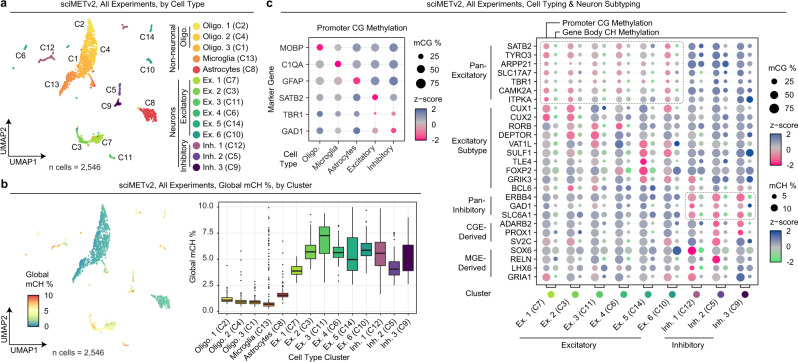
Fig. 4. sciMETv2 cell type analysis and method bias assessment.
a UMAP projection of the three sciMETv2 preparations integrated together colored by cluster. b Global CH methylation levels per cell in the UMAP projection (left) and by cluster (right). For all boxplots, boxes indicate median, 25th and 75th percentiles with min and max lines as 1.5x interquartile range. c Promoter CG methylation levels of marker genes for cell-type-aggregated clusters (left) and both promoter CG methylation and gene body CH methylation for neuronal marker genes and subtype markers. Dashed lines represent clusters showing evidence of positive gene regulation for excitatory (top) or inhibitory (bottom) marker genes.

