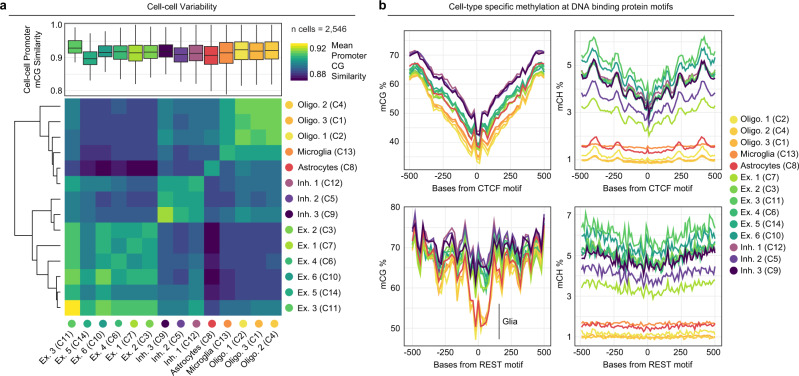
Fig. 5. Cell-cell variability and motif analysis of sciMETv2 data.
a Cell-cell variability as measured by all-by-all methylation similarity at promoter CG sites within each cluster (top), and the mean similarity for cells of different cell types represented as a heatmap (bottom). For all boxplots, boxes indicate median, 25th and 75th percentiles with min and max lines as 1.5x interquartile range. b Assessment of cell-type-specific methylation patterns for CG (left) and CH (right) centered on motifs for CTCF (top) and REST (RE1, bottom). Reduced CG methylation at RE1 sites in glial cell populations is noted.

