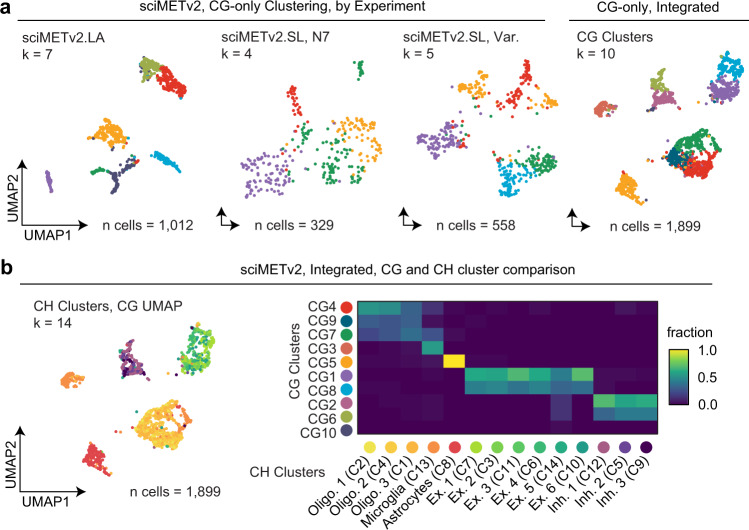
Fig. 7. Analysis of sciMETv2 datasets using CG methylation alone.
a UMAP projections colored by cluster for each sciMETv2 experiment when analyzed using CG methylation alone and for the integrated sciMETv2 dataset processed (right). b CG based UMAP on the integrated dataset as in a, with cells colored by CH methylation clusters that were previously determined and a confusion matrix comparing the CG (y-axis) and CH (x-axis) cluster identities.

