Figure 5.
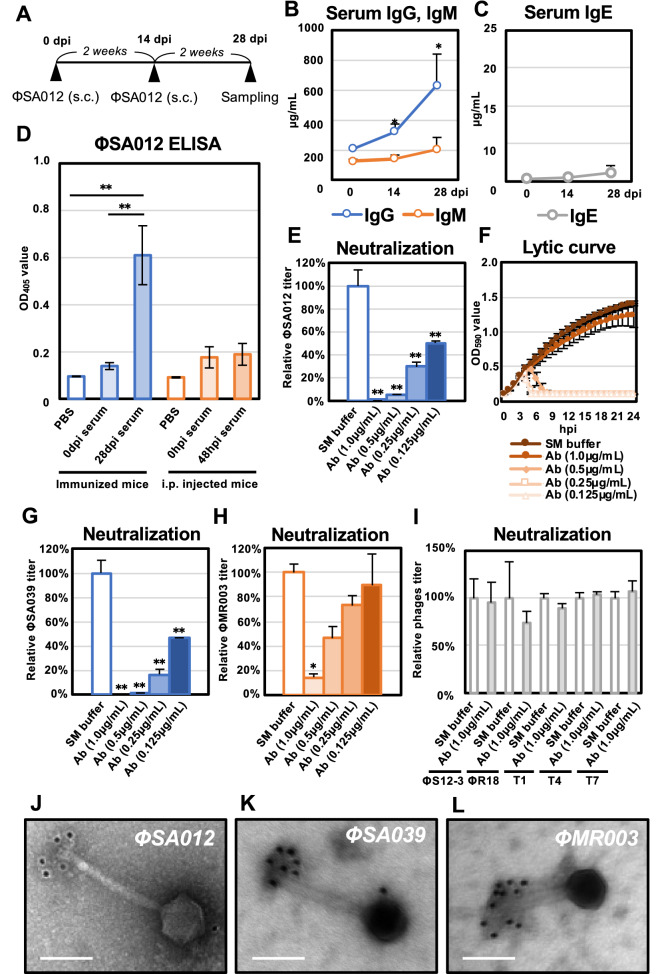
Immune response in mice to ΦSA012. (A) Time course of ΦSA012 immunization in mice by s.c. injection. (B) Concentrations of IgG and IgM in serum samples from immunized mice measured using ELISA. Data are presented as means ± SD (n = 4). Significance against 0 dpi was analyzed by Tukey’s test based on one-way ANOVA: *p < 0.05, **p < 0.01. (C) Concentrations of IgE in serum samples from immunized mice measured using ELISA. Data are presented as means ± SD (n = 4). (D) Anti-phage antibody responses against ΦSA012. Serum samples from mice immunized with s.c. injections or inoculated with i.p. injections of ΦSA012 were tested for phage-specific IgG responses by ELISA. Data are presented as means ± SD (n = 4). PBS was added as a control instead of serum samples in the phage ELISA. Significance among each group was analyzed by Tukey’s test based on one-way ANOVA: *p < 0.05, **p < 0.01. (E) Neutralization activity of purified anti-phage IgG against ΦSA012. The titers of ΦSA012 are indicated as fold changes against the control and presented as means ± SD (n = 3). Significance against control was analyzed by Tukey’s test based on one-way ANOVA: *p < 0.05, **p < 0.01. (F) Lytic curves of SA003 growing in the presence of ΦSA012 treated with purified anti-phage IgG were obtained by monitoring the OD590 until 24 hpi. The individual points in each lytic curve are presented as means ± SD (n = 4). (G and H) Neutralization activity of purified anti-phage IgG against ΦSA039 and ΦMR003. The titers of phages are indicated as fold changes against the control and presented as means ± SD (n = 3). Significance against the control was analyzed by Tukey’s test based on one-way ANOVA: *p < 0.05, **p < 0.01. (I) Neutralization activity of purified anti-phage IgG against Pseudomonas phages ΦS12-3 and ΦR18 and Escherichia phages T1, T4, and T7. The titers of phages are indicated as fold changes against the control and presented as means ± SD (n = 3). Significance against the control was analyzed by t test. (J–L) Immunoelectron micrographs of ΦSA012, ΦSA039, and ΦMR003 stained with a gold-conjugated secondary antibody. White bars represent 100 nm. The size of the gold particles is 12 nm and black spots in the images represent gold particles conjugated to the secondary antibody.

