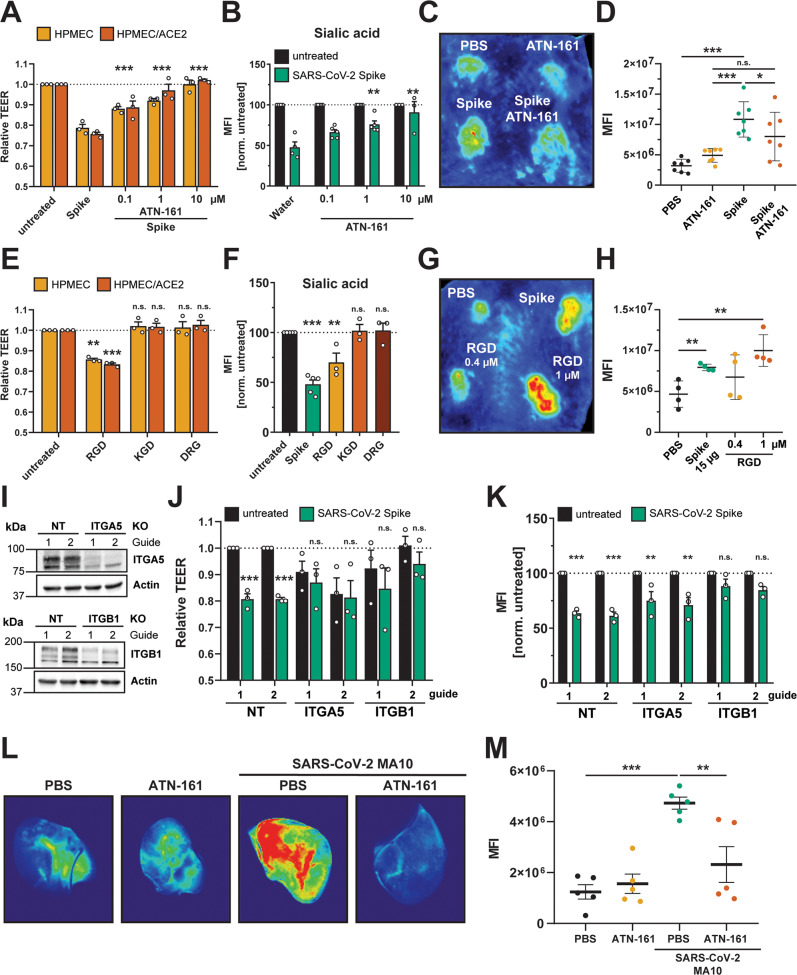
Fig. 6. Integrins are required for SARS-CoV-2 S-mediated and SARS-CoV-2 infection-mediated barrier dysfunction.
A TEER inhibition assay of HPMECs and HPMEC/ACE2 monolayers treated with S (10 µg/mL) and the indicated concentrations of the integrin inhibitor ATN-161. TEER readings were taken 24 hpt with ATN-161 and S added simultaneously to cells. Data are from n = 3 biological replicates. B EGL inhibition assay detecting sialic acid on the surface of HPMEC monolayers treated with S and ATN-161 as in A. Data are from at n = 4 (water), n = 5 (ATN-161 0.1 µM and 1 µM) and n = 3 (ATN-161 10 µM) biological replicates. C Representative back from an intradermal leak assay of mice with the indicated treatments; S (15 µg) and ATN-161 (1 µM) injected simultaneously. D Quantification of C from n = 7 mice. E TEER assay of HPMEC and HPMEC/ACE2 monolayers treated with the indicated peptides at 0.4 µM. TEER readings were taken 24 hpt. Data are from n = 3 biological replicates. F Same as E, but an EGL assay detecting sialic acid on the surface of HPMEC monolayers. Data are from n = 3 biological replicates. G Representative back from an intradermal leak assay of mice with the indicated treatments with S (15 µg) and the indicated doses of RGD peptide. H Quantification of G from n = 4 mice. I Western blot analysis of HPMEC transduced with the indicated lentivirus-encoding guide RNA. Actin was used as a loading control. Data are one representative experiment from n = 3 biological replicates. J TEER assay of HPMEC transduced with lentivirus-encoding guide RNAs targeting the indicated genes as in I. Cells were treated with 10 µg/mL of S, and TEER was read 24 hpt. Data are from n = 3 biological replicates. K EGL assay detecting sialic acid on the cell surface of transduced HPMEC as in J. Data are from n = 3 biological replicates. L Representative lung images from C57BL/6 mice infected with 2 × 10⁴ PFU of SARS-CoV-2 mouse-adapted strain (MA-10) for 7 days. Mice were administered 10 mg/kg ATN-161, or a vehicle control, intraperitoneally daily (8 doses total). Mice were administered a dextran-680 tracer intravenously on day 7 post-infection. Lungs were collected 2 hours after dextran-680 administration and fixed overnight in formalin, and the fluorescence accumulation was measured with a fluorescent scanner. M Quantification of L from n = 5 mice. MFI is mean fluorescence intensity. Dotted lines are the normalized untreated control conditions. All data are as plotted as mean + /− SEM, with *p < 0.05, **p < 0.01, ***p < 0.001, and n.s. p > 0.05 by One-Way ANOVA with Tukey’s Multiple comparisons test except for (D, H, and J) which were analyzed by two-sided unpaired t-test. Statistics in panels E, F, J, and K are comparisons to untreated controls and in panels A and B are comparisons to the S-only control condition.Source data are provided as a Source Data file.

