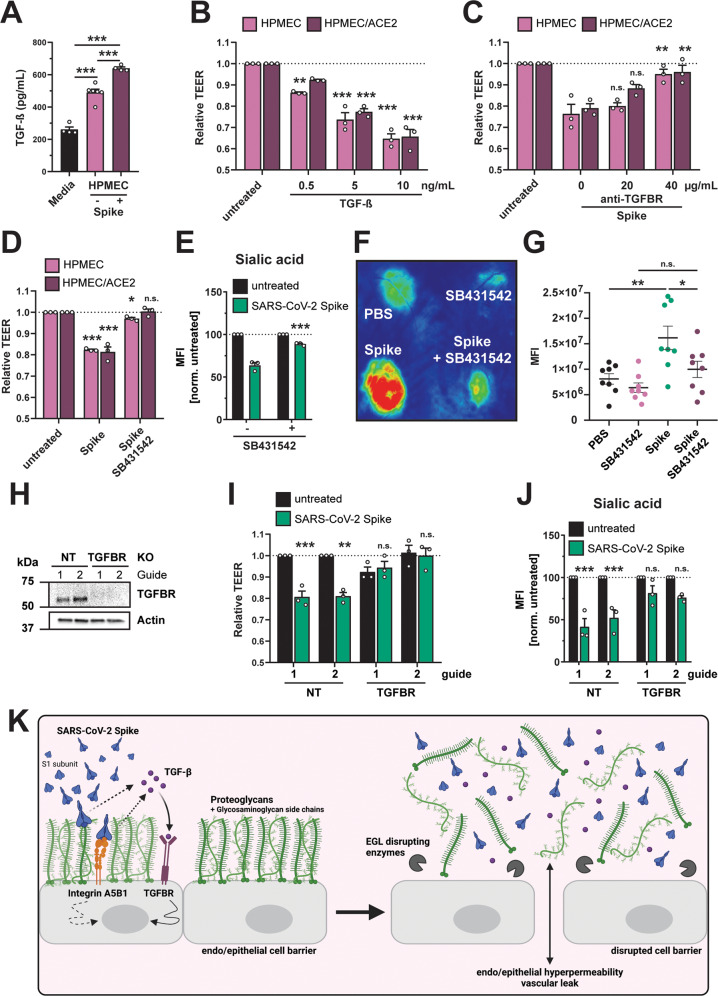
Fig. 7. SARS-CoV-2 S triggers production of TGF-β, and TGF-β signaling is required for S-mediated barrier dysfunction.
A Commercial ELISA detecting TGF-β in medium without cell conditioning (Media), medium from untreated HPMEC, and medium from HPMEC treated with 10 µg/mL SARS-CoV-2 S. Data are from n = 4 (media and HPMEC + S) and n = 6 (HPMEC) biological replicates. B TEER assay measuring the effect of recombinant TGF-β on barrier function of HPMEC at the indicated concentrations. TEER readings were taken 24 hpt. Data are from n = 3 biological replicates. C TEER assay measuring the capacity of an anti-TGFBR antibody, at the indicated concentrations, to abrogate S-mediated endothelial hyperpermeability (S at 10 µg/mL) of HPMECs and HPMEC/ACE2. TEER readings were taken 24 hpt. Data are from n = 3 biological replicates. D TEER assay measuring the capacity of TGFBR inhibitor SB431542 (1 µM) to inhibit S (10 µg/mL) function. Data are from n = 3 biological replicates. E Same as D, except an EGL assay measuring sialic acid. Data are from n = 3 biological replicates. F Representative back from an intradermal leak assay of mice with the indicated treatments; S (15 µg) and SB431542 (1 µM) were injected simultaneously. G Quantification of F from n = 8 mice. H Western blot analysis of HPMECs transduced with lentivirus-encoding guide RNAs targeting the indicated genes. Actin was used as a loading control. Data are one representative experiment from n = 3 biological replicates. I TEER assay on the same HPMEC as in H treated with 10 µg/mL of S and measured 24 hpt. Data are from n = 3 biological replicates. J EGL disruption assay on HPMECs from H, treated with 10 µg/mL S and imaged 24 hpt. Control guide data from this panel are from the same experiment as Fig. 4G. Data are from n = 3 biological replicates. K Graphical abstract summarizing the ACE2-independent pathway by which SARS-CoV-2 S triggers barrier dysfunction. Solid lines represent steps with direct experimental evidence, while dotted lines represent hypothesized steps. For all figures, dotted lines in graphs are the normalized untreated control conditions. MFI is mean fluorescence intensity. All data are plotted as mean + /− SEM with *p < 0.05, **p < 0.01, ***p < 0.001, and n.s. p > 0.05 by One-Way ANOVA with Tukey’s Multiple comparisons test except for (G) which was analyzed by two-sided unpaired t-test. Statistics in panels B, D, I, and J are comparisons to untreated controls and in panels C and E are comparisons to the S-only control condition. Source data are provided as a Source Data file.

