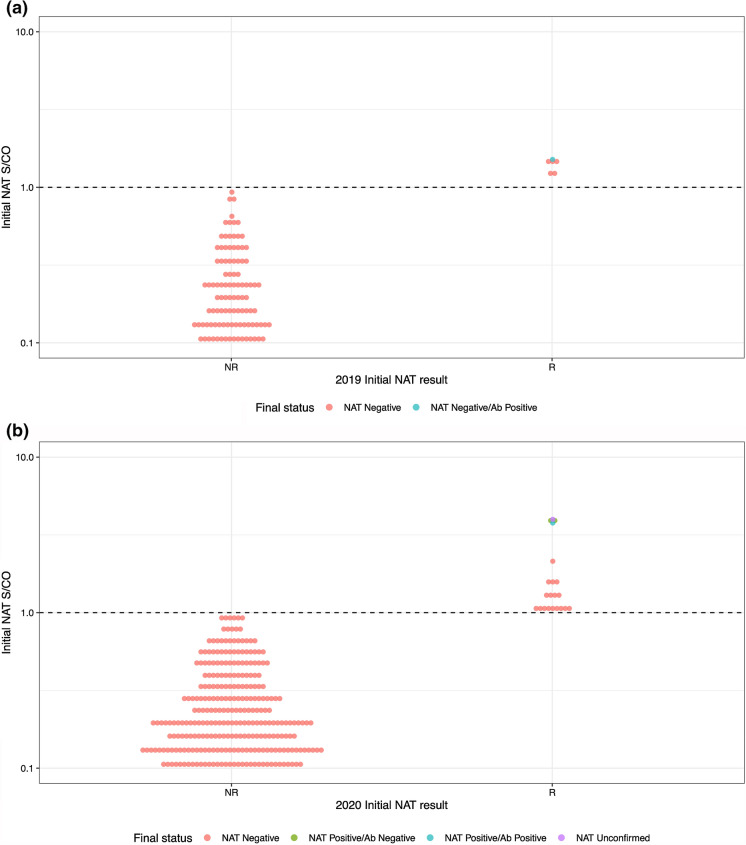
Fig. 3.
S/CO values for all Initial NAT results compared to final test results. A represents 2019 specimen results, while B represents 2020 specimen results. The y axis represents the Signal/Cut Off (S/CO) ratio values obtained on the initial NAT assay. The x axis organizes S/CO values among initial NAT reactive (R) vs initial NAT non-reactive (NR), while also indicating (by color, as labeled) both the final NAT disposition and the Antibody results. See Fig. 1 for results description. The S/CO cutoff between positive and negative results is 1.0. Positive results close to the assay cutoff generally have a higher likelihood of being false-positive than those with higher S/CO values

