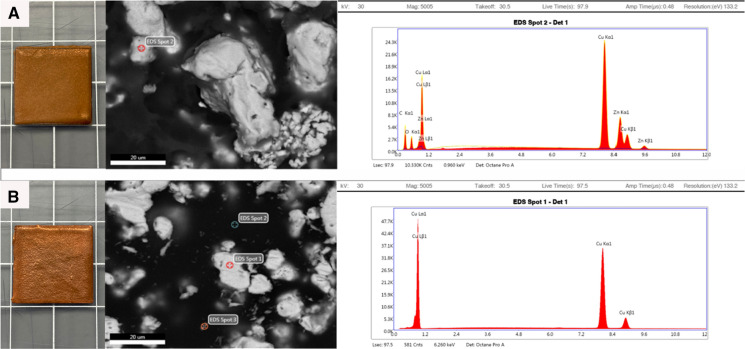
Fig. 1.
Photographs of the appearance of: A) Copper Blend 1 from left to right: tested material in a 2 × 2 cm square, scanning electron microscopy (SEM) done at 5000x, energy-dispersive X-ray spectroscopy (EDS) at 30 kV for 100 s showing composition of Copper Blend 1 Spot 2 to be predominately copper (Cu) 41.61% and zinc (Zn) 14.59%; B) Copper Blend 2 from left to right: tested material in a 2 × 2 cm square, SEM done at 5000x, EDS at 30 kV for 100 s showing composition of Copper Blend 2 Spot 1 to be predominately Cu 100% (background analysis of Copper Blend 2 Spot 2 and Spot 3 were predominantly carbon, 57.64% and 43.18%, respectively)

