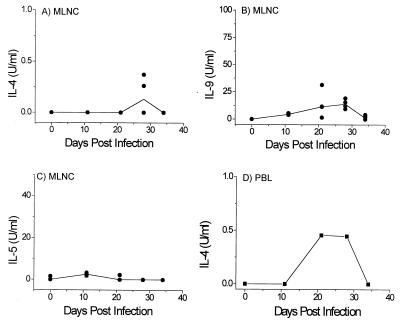
FIG. 2.
Type 2 cytokine production by AKR MLNC (A to C) and IL-4 production by AKR PBL (D) taken at various time points p.i. and restimulated in vitro with T. muris E/S Ag (n = 4 for each time point except for uninfected controls, where n = 3). Day 0 refers to uninfected control animals. In panels A to C, solid lines show median values and circles represent individual animals. PBL at all time points, and MLNC at day 0, were pooled within groups.

