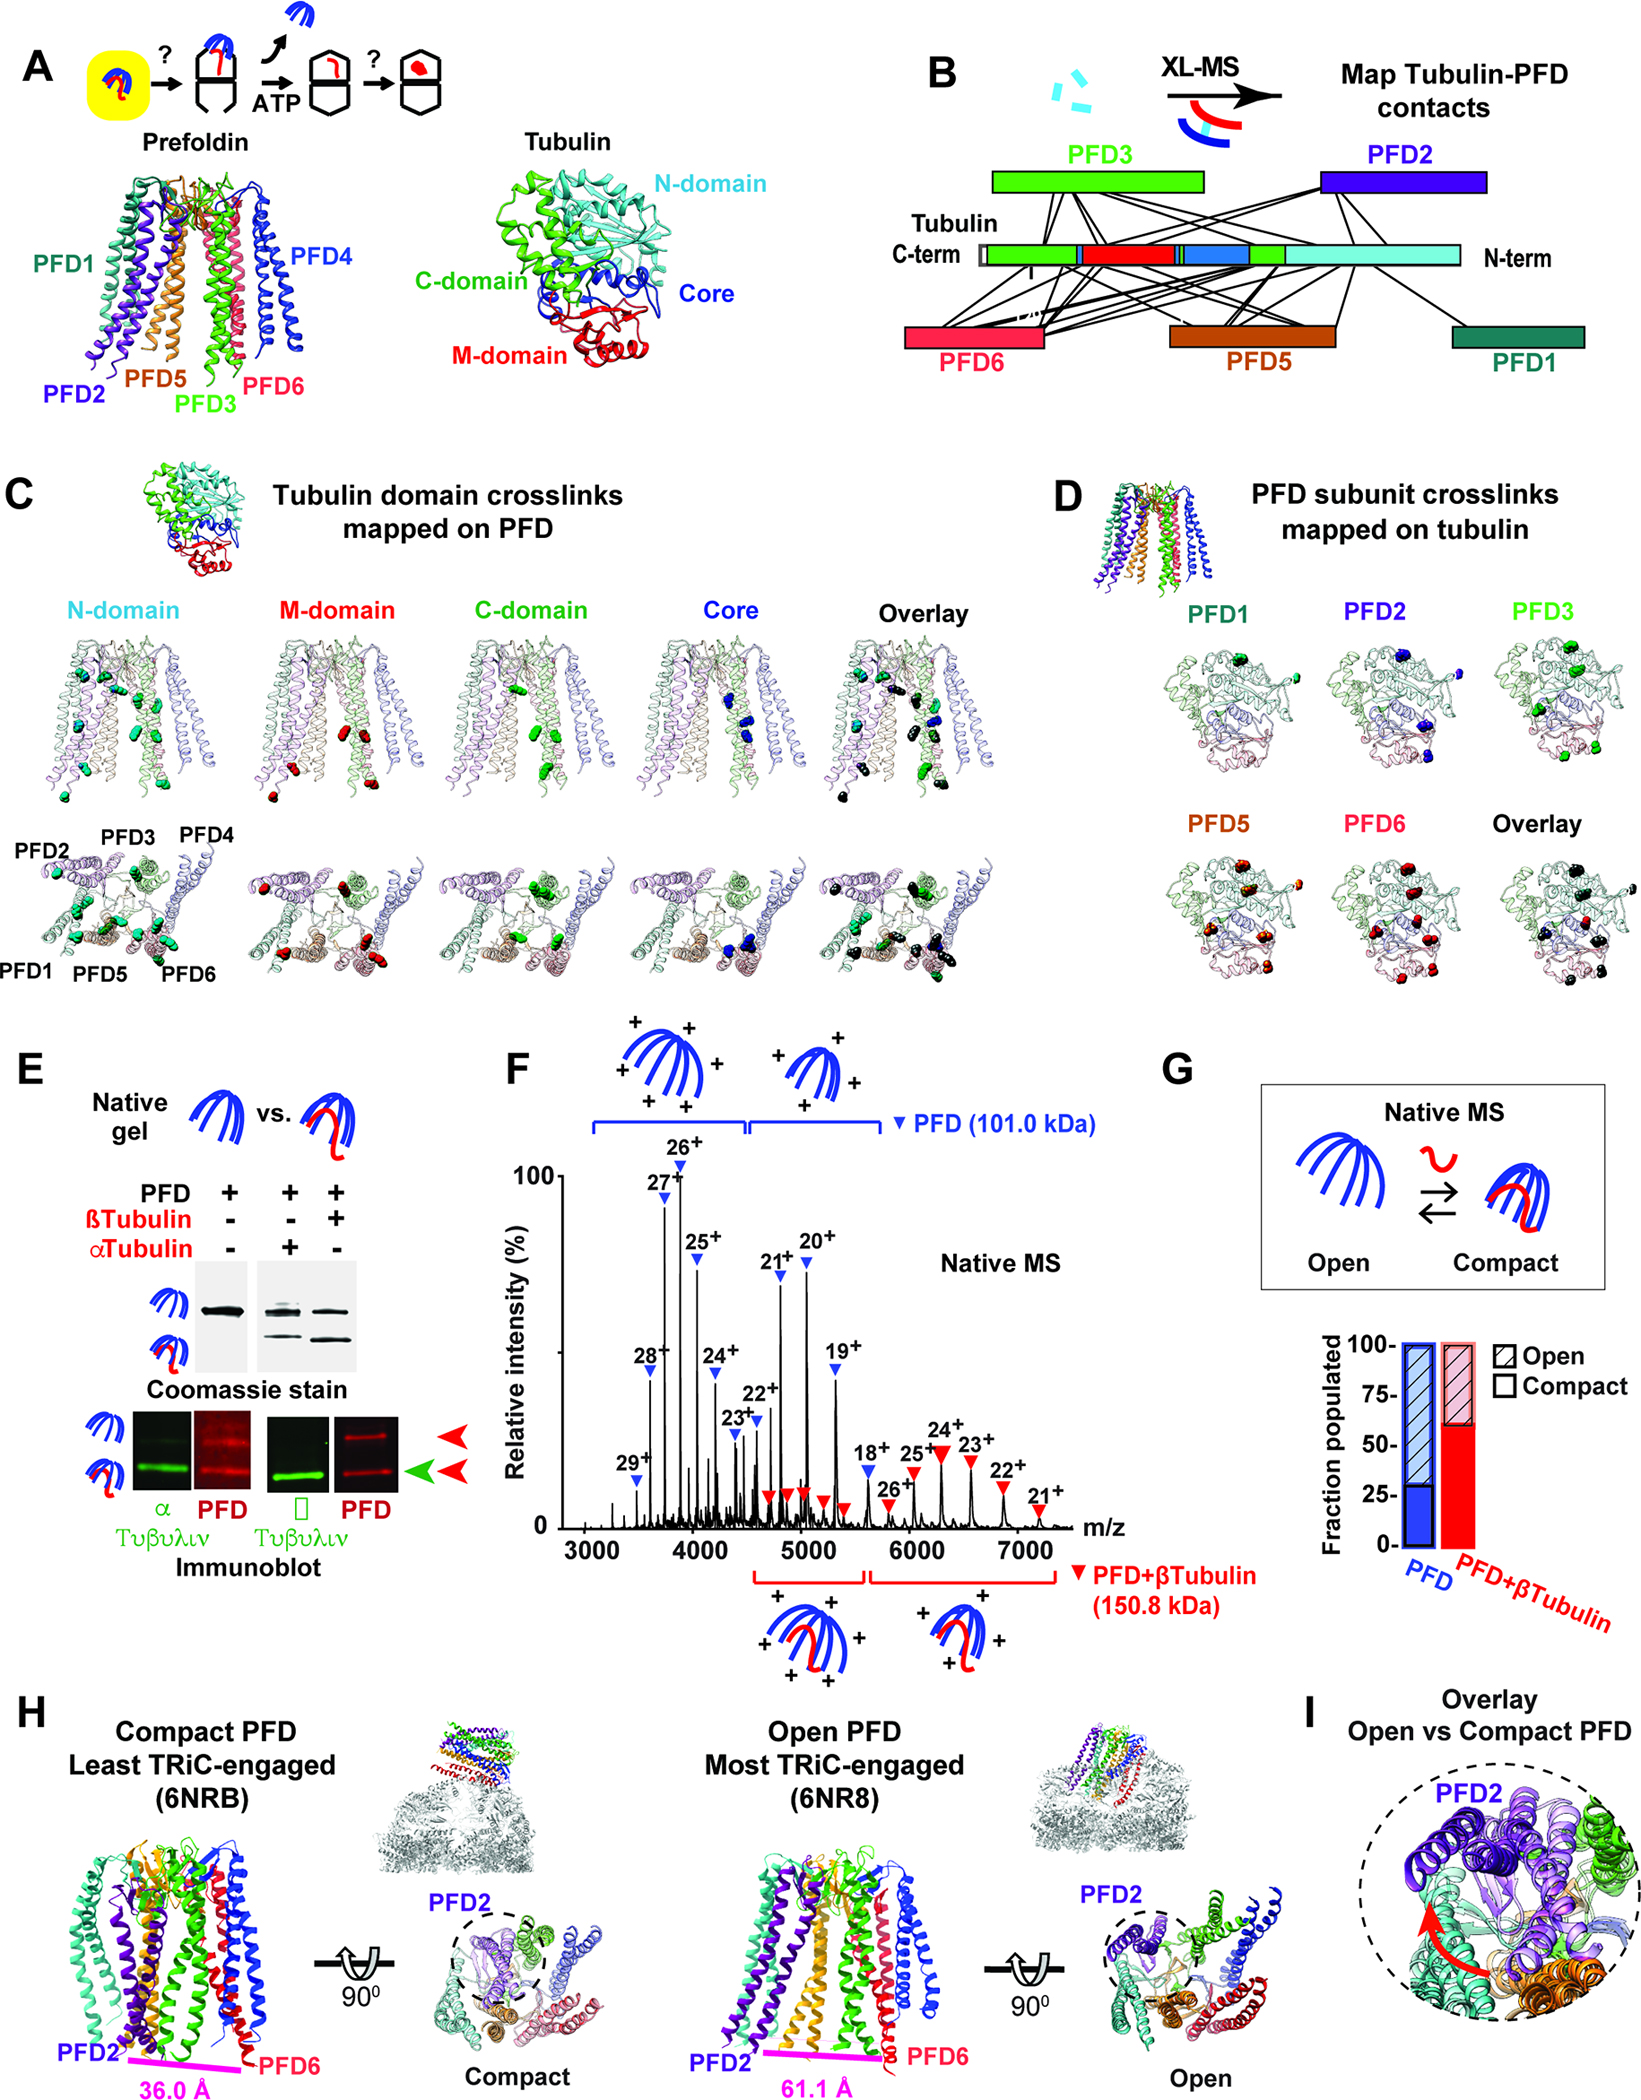
Figure 2: Defining Prefoldin interactions with non-native tubulin.

(A) Role of Prefoldin:tubulin within folding pathway highlighting color scheme for Prefoldin subunits and tubulin domains. (B) XL-MS sites for Prefoldin-bound α- and β-tubulin mapped onto linear bar diagrams of Prefoldin subunits and tubulin domain. (C) All tubulin XL sites mapped onto Prefoldin structure, note XL to unstructured regions of Prefoldin tentacles are mapped to the last resolved residue. (D) XL sites mapped onto the Tubulin structure. (E) N-PAGE followed by immunoblot analyses for Prefoldin with or without bound Tubulin. (F) Representative native MS of Prefoldin with or without bound β-tubulin. Charge state distributions are inferred to “open” or “compact” conformations. (G) Quantification of the fractions of Prefoldin and Prefoldin:β-tubulin populating open and compact conformations by native MS. (H) Structures of Prefoldin from the least engaged (PDB:6NRB11) and most engaged (PDB:6NR811) states with TRiC with distances between the terminal residues of PFD2 (Ile 124) and PFD6 (Glu 114) indicated. (I) Overlay of Prefoldin structures focusing on PFD2 (purple) movement in least engaged (light color) and most engaged (dark color) states.
