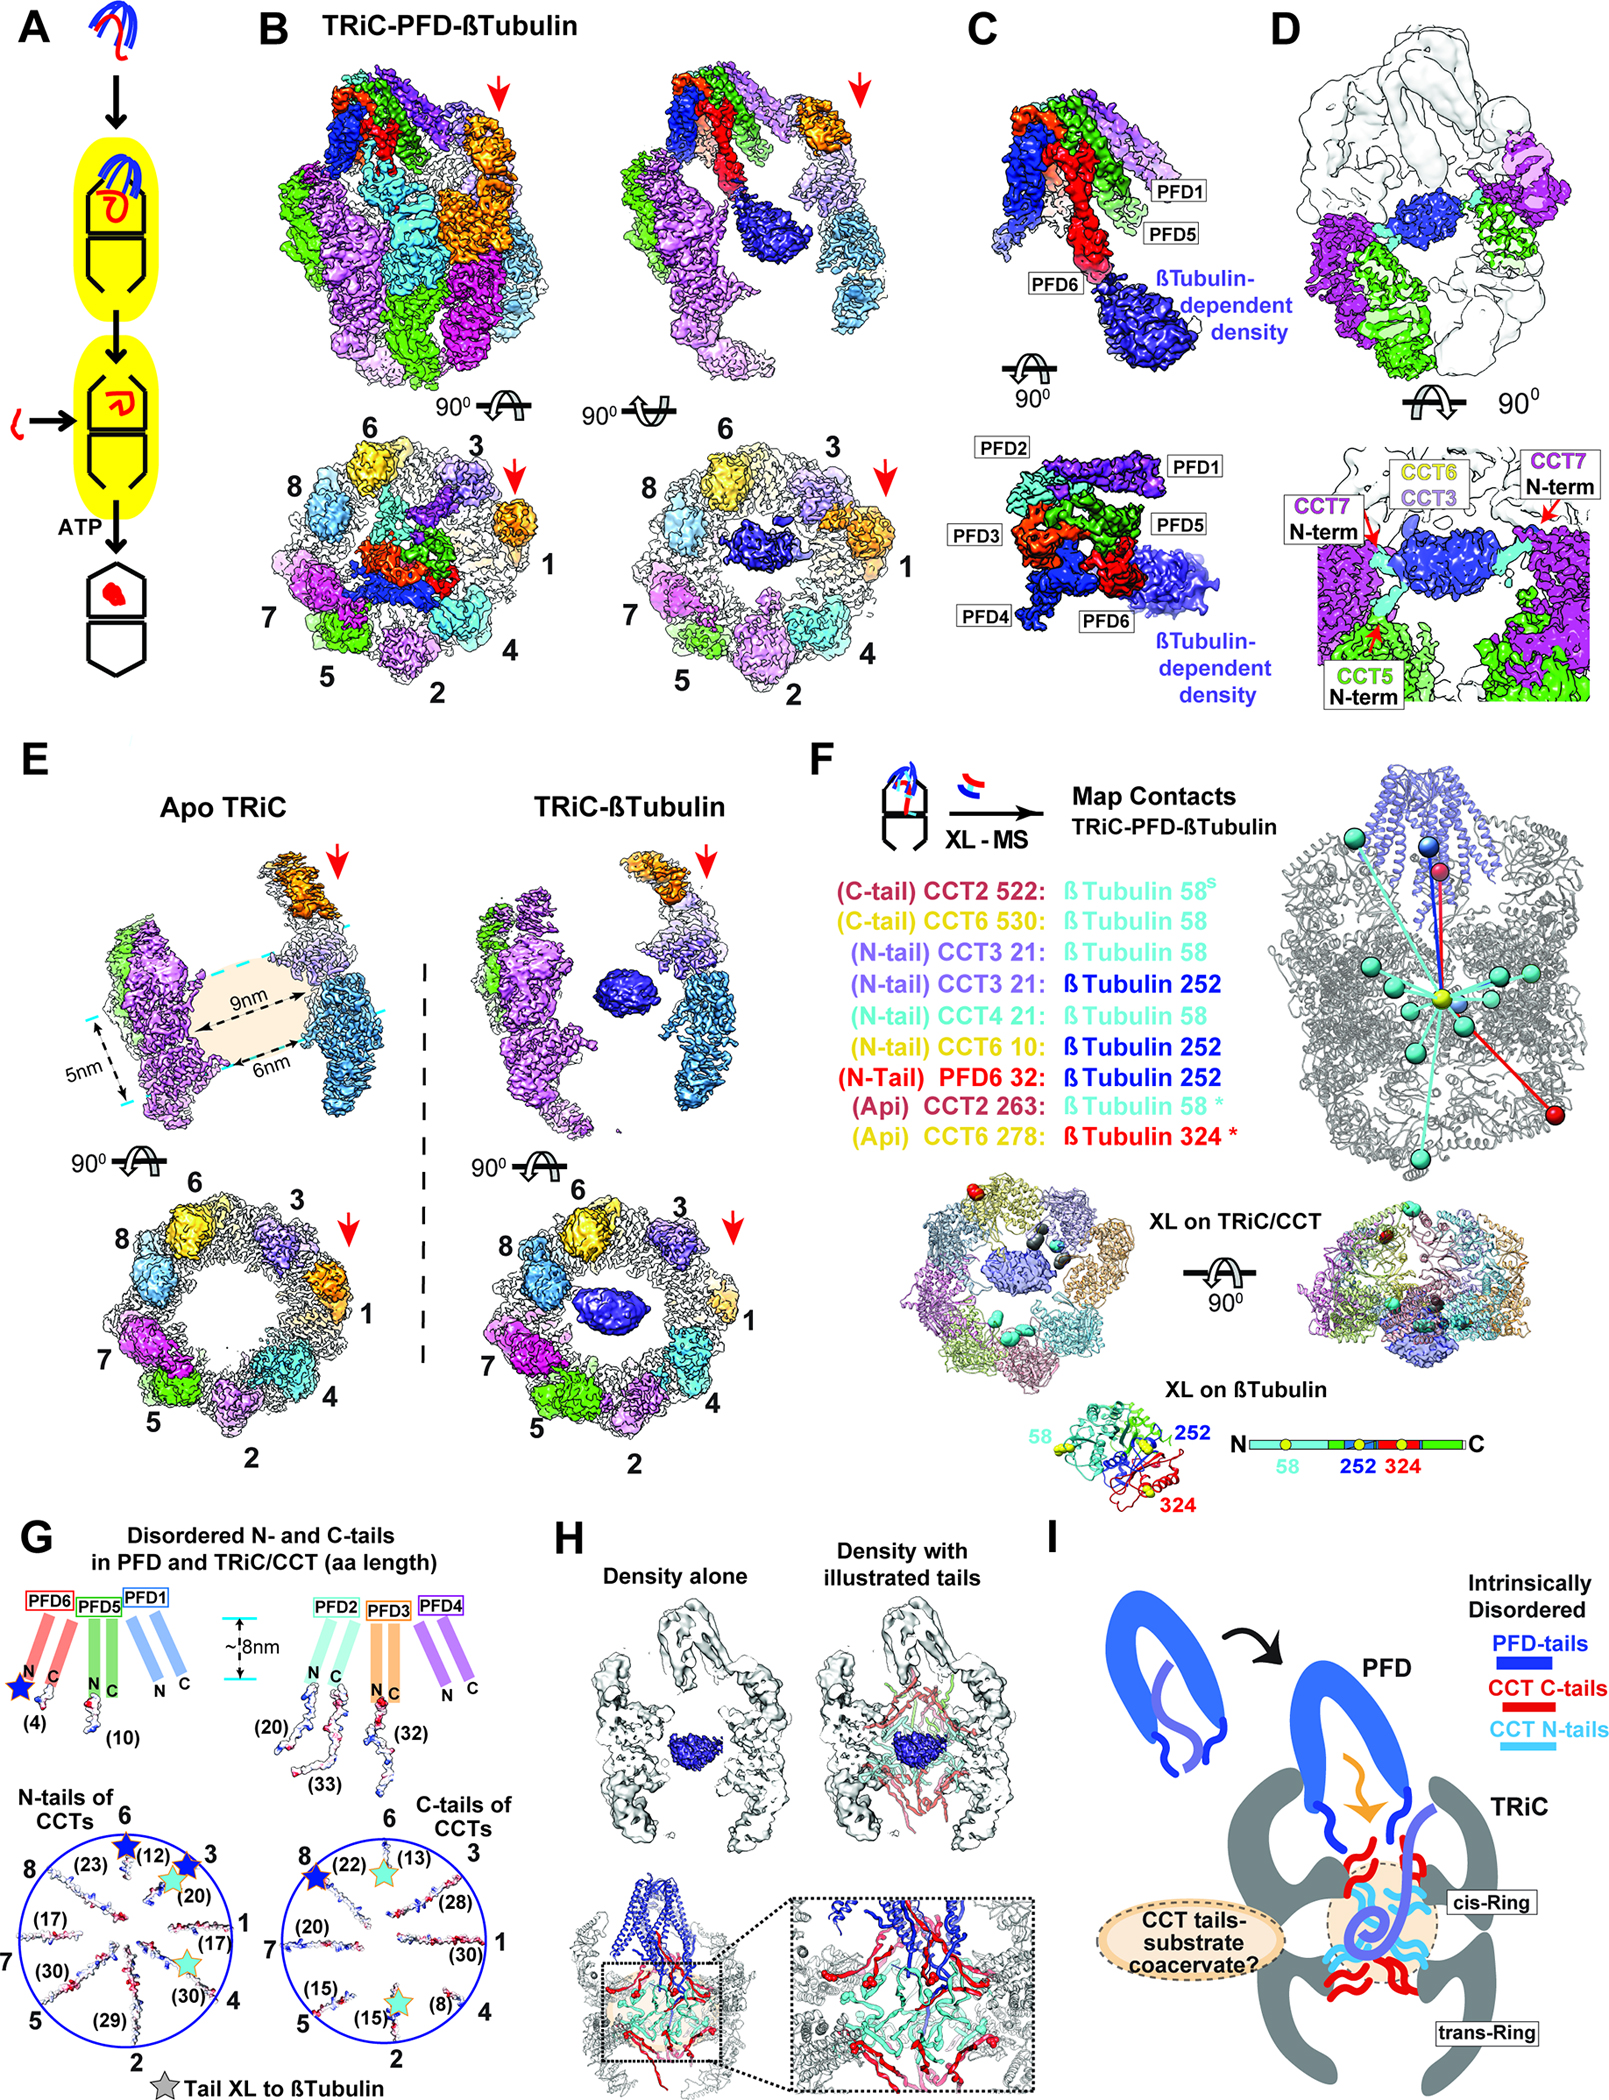
Figure 3: Ternary Prefoldin:β-tubulin:TRiC complex in the open conformation.

(A) Model of substrate loading to TRiC. (B-D) 3D-reconstruction of TRiC-Prefoldin:β-tubulin ternary complex, (B) Side and end-on view of the ternary complex, and slice views showing β-tubulin density bound to TRiC. Red arrows indicate CCT1. (C) Side and end-on views segmented Prefoldin:β-tubulin density. (D) Side and top view at lower threshold to illustrate N-terminal tail contacts from CCT5 and CCT7. (E) Side and top views from 3D-reconstruction of apo-TRiC and TRiC:β-tubulin highlighting the β-tubulin density is absent from apo-TRiC. Red arrows indicate CCT1. (F) TRiC:β-tubulin inter-molecular XL mapped onto the model, note XL are mapped to the center of mass of the density and colored by the domain of Tubulin they XL to. Residues that XL to β-tubulin are highlighted on a single ring of TRiC and colored by the domain of β-tubulin they XL to, residues that XL to multiple domains are colored grey. XL between β-tubulin and TRiC apical domains (*) from previous studies16,58. (G) Schematic of disordered tail residues from the N and C termini of Prefoldin (top) and TRiC (bottom) highlighting their electrostatic surface. Brackets denote the length (as number of residues) of each subunit’s disordered tail. Star: indicates residues within the disordered tails that XL to β-tubulin domains. (H) Schematic of disordered tails in the TRiC inter-chamber space with map (top) and model (bottom). Spheres in the model indicates the location of the first resolved N-terminal (cyan) and the last resolved C-terminal residues (red). (I) Cartoon of substrate delivery by the interplay of TRiC and Prefoldin’s disordered tails. The dotted circle in the TRiC chamber represents a hypothetical coacervate formed by substrate polypeptide and disordered CCT tails.
